Download
1 / 29
290 likes | 306 Views
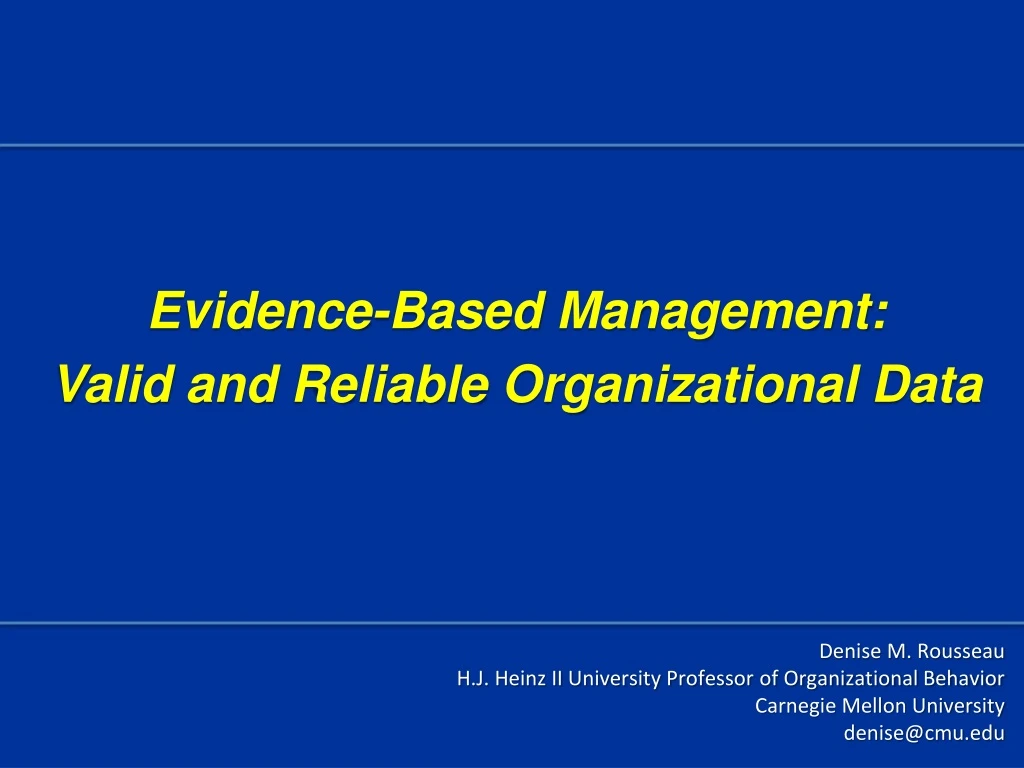
Discover how evidence-based management overcomes the limits of unaided decisions, improves critical thinking, and promotes ethical decision-making using reliable and valid organizational data.

E N D
Evidence-BasedManagement: Valid and ReliableOrganizational Data Denise M. Rousseau H.J. Heinz II University Professor of Organizational Behavior Carnegie Mellon University denise@cmu.edu
EBMgt Overcomes Limits of Unaided Decisions • Bounded Rationality • The Small Numbers Problem of Individual Experience • Prone to See Patterns Even in Random Data • Critical Thinking & Ethics • Research • Large Ns > individual experience • Controls reduce bias • Relevant Org’l Facts • Reliable and valid • Interpreted using appropriate logics • Decision Supports The “Human” Problem Evidence-Based Practice
Five Good EBMgtHabits Get Evidence into the Conversation Use Relevant Scientific Evidence Use Reliable and Valid Business Facts Become “Decision Aware” and Use Appropriate Processes Reflect on Decision’s Ethical and Stakeholder Implications
Different Ways of Thinking about Problems Mechanical Thinking Intuitive Thinking Strategic Thinking Problem Prototype Analysis of Essence Process of Thought Solution Rearrangement of Elements Local Optimization Transformation or changed configuration
Example (1 of 4): the number of operations centres at a major bank were reduced by 82% Example of Consolidation Consolidation in Operating Units over 2 Years 1996 1998-9 Call Centers Credit Granting Credit Management and Recoveries Business Service Centers Personal Service Centers Operations Service Centers 35 15 20 50 15 7 142 4 4 4 5 5 3 25 82% reduction Centres with over 200 FTEs Centres with under 200 FTEs 65% 35%
Example (2 of 4): intuition suggests that the smaller centres should be less efficient than the large centres due to scale economie Expected Result Scale Curve for Traditional Business Indicator of efficiency Non-staff cost/All cost Expected scale curve FTEs in Center Indicator of size of centre
Example (3 of 4): however, the reverse was found to be true Actual Result Contrary to Expectations, Units Don’t Show Expected Scale Benefits (1)… Non-staff cost/All cost Actual Expected scale curve FTEs in Center (1) total cost/FTE vs. FTEs shows same relationship, but with r2 of 44% Source: interviews, financial Q1 1999 operating results; call center economics excludes some centers for which data was not available
Example (4 of 4): this radically altered the course of the project Impacts of the Analysis Knowing that Reverse Scale Economies Existed Assuming that Scale Economies Existed • Understand why reverse scale economies exist (reason: inconsistent policies, practices and processes layered on top of each other from consolidated centres) • Set in place programs to fix the cause of the problem (solution: standardize policies, practices and processes and reduce headcount and cost accordingly) • Consolidate further - further worsening the situation • Aim for generalized headcount cuts to improve financials - further stretching staff Successful Engagement Possible Disaster
An interesting example of the need for facts, correct analysis and presentation Dots indicate O-ring damage for 24 successful space shuttle launches prior to the Challenger failure. Challenger was launched on January 28, 1986 with 31 degree forecast temperature. 3 2 Number of damaged O-rings per launch 1 0 30 35 40 45 50 55 60 65 70 75 80 85 Temperature - Degrees Fahrenheit Sources: 1) From Edward Tufte, Visual Explanations, MS 1991. 2) Report of the Presedential Commission on the Space Shuttle Challenger Challenger Accident (Washington DC, 1986) volume V, pages 895-896, ref. 2/26 1 of 3 and ref. 2/26 2 of 3. 3) Siddhartha R. Dalal, Edward B. Fowlkes and Bruce Hoadley, “ Risk Analysis of the Space Shuttle: Pre-Challenger Prediction of Failure.” Journal of the American Statistical Association, December 1989, page 946.
Use Reliable and Valid Business Facts Best “Available” Business Facts Should • Present Representative Numbers Sampled From Entire Population • Be Interpretable In Context of Use • Provide Key Indicators for Business Decisions • Inform Well-thought Out Logics • Make Sense to Relevant Decision Makers
Use Reliable and Valid Business Facts Best “Available” Business Facts • Present Representative Numbers Sampled From Entire Population (No Cherry Picking!) • not biased single or isolated cases (Look at TOTAL successes & failures not just one or the other) • NOT based on small sample sizes (Aggregate or combine small units to increase reliability and reduce random variation)
How to Interpret Business Facts # Medication errors in Unit 1 were 200% greater in 2011 than Unit 2’s. Is patient safety worse in Unit 1? Mike has w/10 subordinates & 20% turnover while Kim has 55 employees & 10% turnover. Is retention better in one? McDonald’s stores average 300+% turnover/year. Does Mickey D. have a problem?
DATA Raw Observations “Your score is six” “Eight medication errors occurred” Ignores total possible #items on test Neglects Base Rate How many total administrations of medication? #errors plus #non-errors Organizational Context How many in same department? By Same Person?
DATA Challenges: Are data reliable? Complete? Unbiased?
INFORMATION Making Data Interpretable Possible Totals or Percentages “6 out of 10” “60% correct” Base Rate Represented “8 errors out of 450 administrations” Organizational Context Connected When? Where? By Whom? 4 errors made by same person are likely due to different factors than are 4 errors made by different individuals in different departments
KNOWLEDGE Using Information Effectively Informs Well-thought Out Logics that Decision Makers are Skilled in Using Based on critical thinking, consideration of alternatives, and systematic evidence regarding appropriateness InputsProcessesLeadOutcomesLagged Results
KNOWLEDGE Knowledge Provides Key Indicators for Organizational Decisions DIAGNOSIS Is 18% turnover a problem? A good thing? KNOWN IMPACT ON KEY OUTCOMES What’s the success rate of applicants scoring at or above 60% on a test in the first year on the job?
Use Reliable and Valid Business Facts Best “Available” Business Facts Should • INFORM ON THE WELL-BEING, HEALTH AND PERFORMANCE OF THE ORGANIZATION • Lead and lagged indicators reflecting organization’s performance pathways • Lead indicators: critical conditions to be managed in order to achieve important (lagged) outcomes (customer satisfaction) • Lagged indicators: important business outcomes (sales growth)
Use Reliable and Valid Business Facts Best “Available” Business Facts Should • Inform relevant decision makers • Using frames, definitions, and logics they understand • Focus of decision maker attention will largely be influenced by available facts (data, metrics) • Both unit-specific data and organization-wide • If too narrow, other goals may be neglected • If too broad, may be forced to simplify • If not measured, it cannot be rewarded, if not reward, it won’t occur.
Use Reliable and Valid Business FactsFocus of attention is influenced by metrics Division A’s Metrics Budget Compliance 1st,2nd,3rd & 4th Qtr Profitability 1st,2nd,3rd & 4th Qtr Division B’s Annual Metrics Customer Satisfaction Employee Retention Staff Development Return on Assets Portion of Sales from Recently Developed Products
What’s the Question? • A count or percentage • Always an estimate, not “truth” • Report confidence interval (the likely range the true number falls within) 22 Evidence-Based Management: Making Evidence-Based Decisions The QUESTION you are trying to answer determines the ANALYSIS: • How many? • What works? • Is it increasing? Decreasing? • What’s it related to? • Is there a trend?
What’s the Question? • Show if factor really led to outcome change, using: • Comparison of averages • Time series -- % change over time • Before & After (pre/post) tests • Compare to groups without factor – difference scores (t-tests) 23 Evidence-Based Management: Making Evidence-Based Decisions The QUESTION you are trying to answer determines the ANALYSIS: • How many? • What works? • Is it increasing? Decreasing? • What’s it related to? • Is there a trend?
What’s the Question? • Regression analysis tells which of a set of factors are significantly related • Suitable for two kinds of data: • Dichotomous (College YES 1 NO 0) • Continuous (years of education) 24 Evidence-Based Management: Making Evidence-Based Decisions The QUESTION you are trying to answer determines the ANALYSIS: • How many? • What works? • Is it increasing? Decreasing? • What’s it related to? • Is there a trend?
What’s the Question? • Compare with past number • Example: 2012 values divided by 2011’s • What controls do we need to really know what is what? 25 Evidence-Based Management: Making Evidence-Based Decisions The QUESTION you are trying to answer determines the ANALYSIS: • How many? • What works? • Is it increasing? Decreasing? • What’s it related to? • Is there a trend?
What’s the Question? • When and how would you act on it? 26 Evidence-Based Management: Making Evidence-Based Decisions The QUESTION you are trying to answer determines the ANALYSIS: • How many? • What works? • Is it increasing? Decreasing? • What’s it related to? • Is there a trend?
Turning Evidence into Practice & Practice into Evidence Turning evidence into practice Evidence-BasedManagement:Closing the gap between research and practice
Got Evidence? References M. Blastland & A. Dilnot (2007) The Tiger that Wasn’t: Seeing through a World of Numbers. London, Profile Books. D. Kahneman (2011) Thinking, Fast and Slow. New York: Farrar, Straus & Giroux. D. M. Rousseau (2012) Oxford Handbook of Evidence-Based Management, New York. D.M. Rousseau, D.M. & E. Barends (2011) Becoming an evidence-based manager. Human Resource Management Journal, 21, 221-235. N.Silver (2012) The Signal and the Noise: Why So Many Predictions Fail but Some Don’t. New York: Penguin.
Use Reliable and Valid Business Facts Illustration--Discuss with your seatmates… • What indicators does your organization most commonly use to make important decisions? • Are these the “best business facts” you need to make these decisions? • What indicators would be more useful, if you could get them??