Quality Control Charts for Defective Compressor Analysis
Utilizing control charts to monitor defective compressors, analyzing attributes and variables data, and assessing quality characteristics effectively in production processes.

Quality Control Charts for Defective Compressor Analysis
E N D
Presentation Transcript
Control Charts Control Discrete Numerical Data Continuous Numerical Data Charts Variables Attributes Charts Charts R P C X Chart Chart Chart Chart
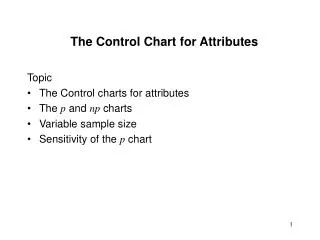
Control Chart Selection Variable (ข้อมูลที่ได้จากการวัดที่เป็นค่าต่อเนื่อง เช่น ความหนา) Attribute(ข้อมูลที่ได้จากการนับที่เป็นไม่ต่อเนื่อง เช่น จำนวนของเสีย) Quality Characteristic Defect (จำนวนตำหนิบนชิ้นงาน) Defective (จำนวนชิ้นงานบกพร่อง) no n>1? x and MR constant sampling unit? yes constant sample size? yes np no x and R n>=10? yes no no yes c u p x and s
ปัญหาที่พบ ประเภทของปัญหา Warranty claim: Compressor เสียงดัง ลูกค้าxxxรุ่นรถยนต์ 2007 3.8Lรุ่นผลิตภัณฑ์ x Compressorรหัสผลิตภัณฑ์ xxx-xxx
Good and Bad part GOOD PART BAD PART
ลักษณะปัญหาที่พบ จุดที่เกิดปัญหา แบริ่ง กระบอกสูบ
Sorting กิจกรรมการคัดแยกของเสีย Old specification New specification NG compressor 6036g in specification NG compressor 6036g out of specification • น้ำหนักของ NG part = น้ำหนักของ OK part – 20 g (น้ำหนักของแบริ่ง 2 ตัว =20g) • จากค่าชี้บ่งคลื่นความถี่วิทยุ (RFID :Radio Frequency Identification)น้ำหนักของ • น้ำหนัก NG part weight = 6036 g. • จากการตรวจสอบความสามารถของน้ำหนักของโมเดลนี้ทำให้เราสามารถตรวจจับ NG part ได้ กระบวนการคัดแยกโดยการตรวจสอบน้ำหนักของคอมเพรสเซอร์จากข้อมูล RFID เราสามารถเลือกบันทึกค่าน้ำหนักจาก RFID data โดยการปรับสเปค (สเปคเดิม: 6015-6115g ; สเปคใหม่ : 6055-6125g)
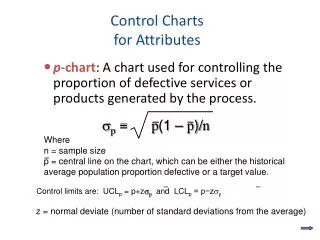
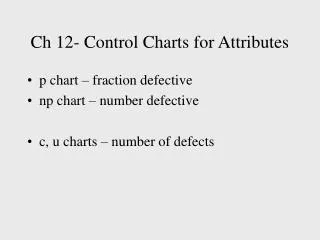
Attribute Types of Attribute Charts: • Nonconforming Units or defectives (based on the Binomial distribution): p chart, np chart. • p chart: สำหรับข้อมูลที่แสดงสัดส่วนของผลิตภัณฑ์บกพร่องโดยจำนวนหน่วยข้อมูลแต่ละกลุ่มย่อยที่ใช้ตรวจไม่จำเป็นต้องคงที่ • np chart: สำหรับข้อมูลที่แสดงจำนวนของผลิตภัณฑ์บกพร่องโดยจำนวนหน่วยข้อมูลแต่ละกลุ่มย่อยที่ใช้ตรวจจำเป็นต้องคงที่หรือเท่ากัน • Nonconformities or defects (based on the Poisson distribution): u chart, c chart. • u chart : สำหรับข้อมูลที่แสดงสัดส่วนข้อบกพร่องหรือตำหนิบนผลิตภัณฑ์ โดยหน่วยที่ใช้ในการตรวจสอบไม่จำเป็นต้องคงที่เช่น รอยตำหนิบนผืนผ้า • c chart : สำหรับข้อมูลที่แสดงจำนวนของผลิตภัณฑ์บกพร่องโดยหน่วยที่ใช้ในการตรวจสอบต้องคงที่หรือเท่ากัน เช่น รอยตำหนิบนผืนผ้า ในพื้นที่ 1 ตารางเมตร
Formula: The fraction nonconforming, p, is usually small, say, 0.10 or less. Because the fraction nonconforming is very small, the subgroup sizes must be quite large to produce a meaningful chart. The P Chart
The P Chart • It can be used to control one quality characteristic, as is done with X bar and R chart, • Or to control a group of quality characteristics of the same type or of the same part, • Or to control the entire product. • It can be established to measure the quality produced by a work center, by a department, by a shift, or by an entire plant.
The P Chart • It is frequently used to report the performance of an operator, group of operators, or management as a means of evaluating their quality performance. • The subgroup size of the P chart can be either variable or constant.
The P Chart Objectives of the P Chart: • Determine the average quality level: This information provides the process capability in terms of attributes. • Bring to the attention of management any changes in the average. • Improve the product quality: Ideas for quality improvement.
The P Chart Objectives of the P Chart cont’d: • Evaluate the quality performance of operating and management personnel. • Suggest places to use X bar and R chart: They are more sensitive to variation. • Determine acceptance criteria of a product before shipment to the customer.
The P Chart P-Chart Construction for Constant Subgroup Size • Select the quality characteristic(s): • Single quality characteristic. • Group of quality characteristics. • A part. • An entire product. • A number of products. • It can be established for performance control of an operator, work center, department, shift, plant, or corporation
The P Chart P Chart Construction for Constant Subgroup Size. • Determine the subgroup size and method: • The size of the subgroup is a function of the proportion nonconforming. • A minimum size of 50 is suggested as a starting point.
The P Chart P Chart Construction for Constant Subgroup Size. • Collect the data: • At least 25 subgroups. • Different sources (Check sheet). • For each subgroup the proportion nonconforming is calculated by the formula P = np/n
P Chart Construction for Constant Subgroup Size. Calculate the trial central line and the control limits: The P Chart
P Chart Construction for Constant Subgroup Size cont’d. Establish the revised central line and control limits. The P Chart
The P Chart P Chart Construction for Variable Subgroup Size • Collect the data. • Determine the trial central line and control limits: Since the subgroup size changes each day, limits must be calculated for each day.
The P Chart P Chart Construction for Variable Subgroup Size. • As the subgroup size gets larger, the control limits are closer together. • Establish revised central line and control limits:
Minimizing the Effect of Variable Subgroup Size Control limits for an average subgroup size: By using an average subgroup size, one limit can be calculated and placed on the control chart. The P Chart
The P Chart Minimizing the Effect of Variable Subgroup Size cont’d. Case I: This case occurs when a point (subgroup fraction nonconforming) falls inside the limits and its subgroup size is smaller than the average subgroup size. Case II: This case occurs when a point (subgroup fraction nonconforming) falls inside the average limits and its subgroup size is larger than the average subgroup size.
The P Chart Minimizing the Effect of Variable Subgroup Size cont’d. Case III: This case occurs when a point (subgroup fraction nonconforming) falls outside the limits and its subgroup size is larger than the average subgroup size. Case IV: This case occurs when a point (subgroup fraction nonconforming) falls outside limits and its subgroup size is less than the average subgroup size.
The np Chart Number Nonconforming Chart (np): • The np chart is easier for operating personnel to understand than the p chart. • The limitation that this chart has is that the subgroup size needs to be constant.
The np Chart Number Nonconforming Chart (np): • If the fraction nonconforming po is unknown, then it must be determine by collecting data, calculating trial control limits, and obtaining the best estimate of po.
Process Capability • For an attribute this process is much simpler. • The process capability is the central line of the control chart. • Management is responsible for the capability. • When the plotted point is outside the control limit, operating personnel are usually responsible.
Control chart (example 1) Fraction defective for electric machine part
Control chart (example 2) The data of electroplating part defectives, the sample size = 100 UCL = 10.39 LCL = 0