Download
1 / 16
160 likes | 180 Views
Learn about limits, how they determine function values, and why they matter. Find limits graphically and numerically, and see examples of when limits fail to exist. Explore the concept of limit from both sides to identify its existence, and grasp the epsilon-delta definition for a clear understanding.

E N D
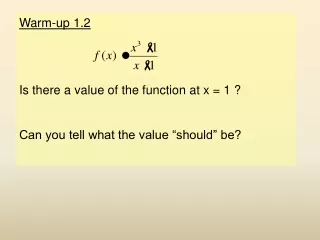
Warm-up 1.2 Is there a value of the function at x = 1 ? Can you tell what the value “should” be?
Why limits? • Not all functions have y-values (or seem to have more than 1 y-value) at an x-value • Limits allow us to determine what the value “should” be → approaches • From the warm-up The limit of f(x) as x approaches 1 is 3.
Limits input output For now, we will calculate the limits numerically (table) or graphically
Limits Failing to Exist • f(x) approaches different numbers from left and right sides • f(x) approaches infinity as it approaches • f(x) oscillates between two numbers as it approaches
Summary • Limit must approach a single value from left and right side to exist. • Limit value is equal to the number the limit approaches.
Graph the function f(x) = 2x – 5 What if someone told us we just need the function values to be within a certain range of the limit? Then, what would be the range of x values to keep the function values within this range? Could we have guessed the relationship between the errors from the equation?