Download

1 / 6
60 likes | 72 Views
Learn how to measure and improve key performance indicators (KPIs) across areas including customers, financials, internal processes, human capital, products/services, and more. Discover examples of relevant lead and lag indicators. Understand the importance of tracking metrics to drive success in your business.

E N D
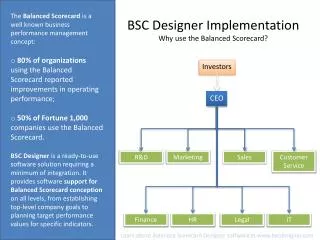
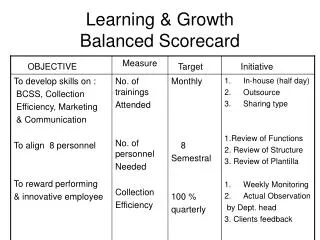
Customers Financials (Lag Indicators) (Lag Indicators) Internal Processes Products/Services Human Capital (Lead Indicators) (Lead Indicators) The Balanced Scorecard & KPI’s “You can’t improve what you don’t measure” (Kaplan & Norton)
Examples of KPI’s might include: • No. of Leads per Month • No. of Quotes/Proposals per Month • No. of New Projects Won per Month • No. of New Customers per Month • No. of Repeat Customers per Month • No. of Active Customer per Month • New Customers/Lost Customers Ratio • Average Customer Response Time • Customer Satisfaction Level (survey rating) • No. of Customer Complaints per Month • No. of Missed Orders/Lost Orders per Month • No. of Warranty Calls per Month • No. of Product Returns per Month • Total Sales per Customer per Month • % of Market Share • No. of Customers or Sales per Staff
Examples of KPI’s might include: • Total Sales per Service Line per Month • Total Net Revenue per Month • Total Net Profit per Month • Profitability/Sales Ratio (%) • Revenue/Expense Ratio (%) • Stock Turns per Item per Month • Debt/Equity Ratio • Interest Coverage • Current Ratio • Accounts Receivable Days • Accounts Payable Days • Inventory Days • Return on Assets • Return on Equity • Return on Capital Employed (ROCE) • Share Price
Examples of KPI’s might include: • Development of new Products/Services • No. of New Ideas per Month • No. of Procedures Documented. • DIFOT • No. of Rings before Phone Answered • No. of Quality Defects • Pollution/Emission Levels • Production Costs • Productivity Improvements • Wastage Improvements • Implementation of New Tools/Technology • Knowledge/IP Management Framework • Accident/Injury Rate & Lost Time • Community Groups/Projects Sponsored • Compliance with Regulatory Requirements
Examples of KPI’s might include: • Staff Turnover Rate • Average Length of Service for Employees • No. of Employees & Recruitment Targets • Absenteeism/Sick Leave Levels • No. of Training Hours per Staff • Total Training Cost per Staff Member • No. of Staff Cross Trained in Skills • Performance Reviews Completed • Staff Incentives • No. of Cross Department Assignments • Staff Satisfaction Level (survey)
Getting Started: • Identify which metrics to include - need to reflect drivers behind SCA, indicators relating to • Revenue Model Cause/Effect, other CSF & measures of interest important to overall strategies. • Set the metric, do a baseline calculation (where we are today) and set realistic target. • Determine if reporting systems (Output) and business procedures support the gathering (Input) • and presentation of this data/information. • Need to identify the source of that information and ensure it’s accuracy, completeness and timeliness. • Need to review Balanced Scorecard regularly (ie. monthly) to address ‘trouble spots’ & reset actions. • Explore automated tools to assist with reporting progress & performing analysis – EIS One.