Download
1 / 10
100 likes | 489 Views
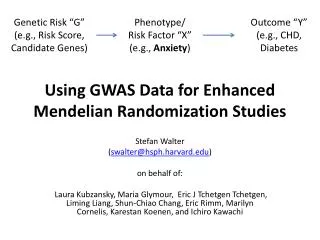
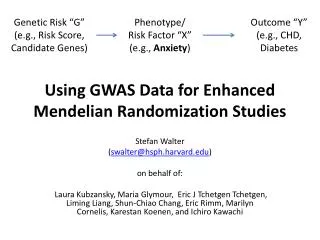
Genetic Risk “G” (e.g., Risk Score, Candidate Genes). Phenotype/ Risk Factor “X” (e.g., Anxiety ). Outcome “Y” (e.g., CHD, Diabetes. Using GWAS Data for Enhanced Mendelian Randomization Studies. Stefan Walter ( swalter@hsph.harvard.edu ) on behalf of:

E N D
Genetic Risk “G” (e.g., Risk Score, Candidate Genes) Phenotype/ Risk Factor “X” (e.g., Anxiety) Outcome “Y” (e.g., CHD, Diabetes Using GWAS Data for Enhanced Mendelian Randomization Studies Stefan Walter (swalter@hsph.harvard.edu) onbehalfof: Laura Kubzansky, Maria Glymour, Eric J TchetgenTchetgen, Liming Liang, Shun-Chiao Chang, Eric Rimm, Marilyn Cornelis, KarestanKoenen, and Ichiro Kawachi
Outline • Setting • Projects: • Anxiety, Depression, SocialTies • Results • Methods and Instruments: • Using the Genetic Risk Score as an Instrument • Leave One Out Approach • Instrumental Inequality Tests • Future: • including interactions in score (GxG, GxE)
Setting • NHS I • n = 7000 (NHST2D, NHSCGEMS, NHSCHD, NHSKS) • age at blooddraw = 59.5 (SD 8) • HPFS • n = 4125 (HPFST2D, HPFSCHD, HPFSKS) • age at blooddraw = 62.2 (SD 9) Genotypedondifferent chips (Illumina, Affy), HapMap and 1000g imputationavailable.
Projects • Anxiety: • Crown Crisp Experimental Index (phobic anxiety) • Depression • long-term composite depressive symptom score (1992-2006). • Social Ties • social isolation and ability to connect with others (continuously married versus otherwise).
Results • Depression and Anxiety: • No evidence of a geneticinstrumentfromadditiveinternal GWA risk score, candidate genes, orexternal GWA risk score (R2 < 0.1%, mostlynotsignificant) Butinconsistentresultsfrom chip heritability (GCTA): NHS_T2D, Affy 6.0, 0.214349 NHS_CGE, Illumina 550k, 0.062074 NHS_CHD, Affy 6.0, 0.305586 NHS_KS, Illumina 610Q, 0.000001 HPFS_T2D, Affy 6.0, 0.214349 HPFS_CHD, Affy 6.0, 0.200122 HPFS_KS, Illumina 610k, 0.046558
Genetic Risk “G” (e.g., Risk Score, Candidate Genes) Phenotype/ Risk Factor “X” (e.g., BMI) Outcome “Y” (e.g., Anxiety, Depression, Social Ties) • Advantage: • Knowngeneticrelationshipfor BMI (Speliotes et al. Association analyses of 249,796 individuals reveal 18 new loci associated withbodymassindex). • Replicates in NHS/HPFS explaining 2% of variance. • Challenge: • Analysiswithinnested case-control (NCC) samples (allbut KS) requires IP weightingtoallowunbiasedinferencebasedonthe original samplingpopulation. • Currently, we are recreatingtherisk sets basedonthepublishedmatchingcriteriausedto derive the NCC.
Methods and Instruments (1): • Genetic Risk Score applying allele scoring (Purcell et al., 2009): • Derived from internal GWAS • Approach: running GWAS in 7 samples, meta-analyzing 6 and scoring in set number 7. Iterative leave one out procedure and subsequent meta-analysis of results. • Derived from published GWAS (Speliotes et al, 2010; Demirkan et al., 2010) • Derived from Candidate Genes
Methods and Instruments (2): Glymour, TchetgenTchetgen, Robins., CredibleMendelianRandomizationStudies: Approaches for Evaluating the Instrumental Variable Assumptions, Am J Epi2012 Genetic IVs cannot be proven to be valid. They can sometimes be shown to be invalid, although these tests generally rely on additional assumptions. • Four empirical approaches to (in)validation: • Leverage prior causal assumptions regarding the confounding of the phenotype-outcome association: 4 equivalent versions of this test. • Identify factors that modify the genotype-phenotype association and compare the IV effect estimate across values of the modifier. • Instrumental inequality tests: applicable only when the causal phenotype is known to be categorical. • Over-identification tests with multiple IVs. Other genes or even polymorphisms of the same gene might provide additional IVs. *Instrumental Inequality Test • Macros available (R, SAS) fordichtomousoutcome, dichotomousphenotype, and ploytomousinstruments
Future Testing and includingGxG, GxE • KnownProtein x Proteininteractionstoinformunderlying SNP x SNP interactions. (anxiety) • Investigategenderdifferences. (anxiety) • QuantileRegressiontoidentify and quantifyinteractionswith (unknown) environmentalfactors. • Construct separate scores based on presumed mechanism (e.g., appetite, adipogenesis, cardio-pulmonary fitness) and apply over-identification tests. • GetaccesstotheHealthRetirementStudygenetic data fromdbGaPtoincreasesamplesizeforpsycho-social phenotypes.
Acknowledgements & Contact: NIH/NIHM 1RC4MH092707 (L Kubzansky) And the entire team: Laura Kubzansky, Maria Glymour, Eric J TchetgenTchetgen, Liming Liang, Shun-Chiao Chang, Eric Rimm, Marilyn Cornelis, KarestanKoenen, and Ichiro Kawachi Please feel free to contact us, we are happy to share thoughts, code, macros, etc. Stefan: swalter@hsph.harvard.edu Laura: lkubzans@hsph.harvard.edu Maria: mglymour@hsph.harvard.edu