Download
1 / 22
220 likes | 292 Views
Speech perception in noisy environments can be improved by processing speech to include properties of clear speech. This study presents a technique for accurate stop landmark detection in continuous speech using Gaussian Mixture Modeling. By applying this technique, high burst detection rates were achieved. The study focuses on the importance of acoustic landmarks and the challenges in stop perception, especially in adverse conditions. The Gaussian Mixture Modeling approach aims to enhance burst and transition segments to boost speech intelligibility under challenging listening conditions.

E N D
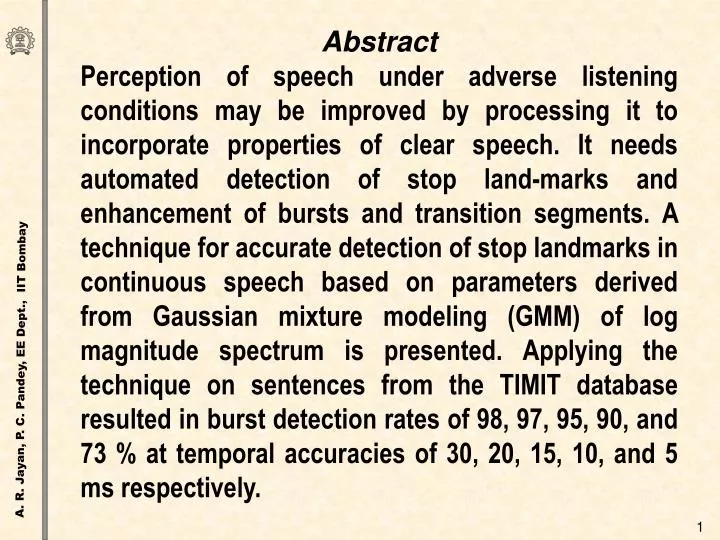
AbstractPerception of speech under adverse listening conditions may be improved by processing it to incorporate properties of clear speech. It needs automated detection of stop land-marks and enhancement of bursts and transition segments. A technique for accurate detection of stop landmarks in continuous speech based on parameters derived from Gaussian mixture modeling (GMM) of log magnitude spectrum is presented. Applying the technique on sentences from the TIMIT database resulted in burst detection rates of 98, 97, 95, 90, and 73 % at temporal accuracies of 30, 20, 15, 10, and 5 ms respectively.
/apa/ Closure ▲ Release burst ▲▲ Onset of voicing 1. INTRODUCTIONAcoustic LandmarksRegions with concentration of phonetic information, important for speech perceptionStop Landmarks Closure Release burst Onset of voicing
Problems in Stop Perception Perception of transient sounds with low intensity severely affected by noise / hearing impairment Clear Speech Style adapted by speakers under noisy conditions (~17 % more intelligible than conversational speech) Acoustic landmarks modified in duration & intensity ‘the book tells a story’ ◄Conversational ▼Clear
Speech Intelligibility Enhancement Using Properties of Clear Speech Automated detection of landmarks with Good temporal accuracy High detection rate and low false detections Modification of speech characteristics around the stop landmarks
Some Earlier Landmark Detection Techniques Liu (1996): Rate-of-rise measures of parameters from a set of fixed spectral bands. Detection rate: 84 % at 20-30 ms, ~50 % at 5-10 ms. Niyogi & Sondhi (2002): Optimal filtering approach with log energy, log energy in the band > 3 kHz & Wiener entropy. Detection rate 90 % at 20 ms.
ObjectiveDetection of stop landmarks using Gaussian mixture modeling (GMM) of speech spectrum▪ for improving the temporal accuracy of detection and reducing insertion errors▪ with adaptation to speech variability▪ for enhancing burst and transition segments to improve speech intelligibility under adverse listening conditions
2. GAUSSIAN MIXTURE MODELING OF SHORT- TIME SPEECH SPECTRUMApproximation of spectrum using a weighted sum of Gaussian functionsMeans Variances Mixture weights Good spectral approximation with 4 or 5 Gaussians (approximating the spectral resonances) Adaptive to speech variability
Spectral Modeling Short-time log magnitude spectrum of speech signal (S.R. = 10 kHz) 6 ms Hanning windowed frames (for suppressing the harmonic structure) 1 frame per ms (for tracking abrupt variations) 512-point DFT Estimation of GMM parameters using Expectation Maximization (EM) algorithm
Estimation of GMM Parameters Spectrum treated as histogram with rectangular bins placed at each frequency index Iterative computation of parameters as maximum likelihood estimates Initialization Means: Average formant frequencies [600, 1200, 2400, 3600 Hz] Variances: Extreme formant bandwidths [160, 200, 300, 400 Hz] Mixture weights: Equal for all Gaussians Number of iterations: ≤ 12
Example: Modeling for a segment of vowel /a/ Modeling of a segment of vowel /a/: (a) windowed segment of 6 ms, (b) log magnitude spectrum (in dB), (c) smoothened spectrum (in dB), (d) GMM approximated spectrum with dotted lines indicating the individual Gaussian components. Ag(n) g(n) g(n)
3. DETECTION OF STOP LANDMARKSDetection based on Rate of change (ROC) of GMM parameters Voicing onset offset detector Spectral flatness measure
GMM Rate of Change Ag, g, gsmoothened by 30-point median filter ROC: First difference (time step = 2 ms) ROC Peak → Possible location of burst onset
Voicing Onset-Offset Detection[Liu, 1996] Energy variationsE(n)in 0:400 Hz band (6 ms Hanning windowed segments, every 1 ms) Rate-of-rise re(n) with 26 ms time-stepVoicing onset [+g]: re(n) +9dB Voicing offset [-g]: re(n) -9dBSpectral Flatness Measure[Skowronski & Harris, 2006](20 ms Hanning windowed segments, every 1 ms) Fricative segments: SFM 1 Voiced segments: SFM 0
Stop Landmark Detection For a voicing onset [+g] or voicing offset [-g] at t, locate the preceding [+g] or [-g] If [-g] at t0,select GMM ROC peak at tb during (t0-50, t ms), Else select GMM ROC peak at tb during (t-50, t ms) as the burst candidate. A burst is declared, if {SFM > 0.5 for 1 ms during (tb-15, tb+15 ms)} and{each of the norm. ampl. A2, A3, A4< 0.5 for at least 10 ms during (t0, tb)}. For burst at tb, closure is located at t0, and voicing onset at t.
(a) (b) (c) Ag(n) g(n) (d) g(n) /apa/: Waveform (a), Gaussian parameter tracks (b: 1st, c: 2nd, d: 3rd, e: 4th). (e)
(a) (b) (c) (d) /apa/: Waveform (a), Spectrogram (b), GMM spectrogram (c), Gaussian ROC (d)
(a) t0 +g (b) -g t (c) SFM (d) ROC peak A2 tb (e) A3 A4 /apa/: Waveform (a), -g, +g peaks (b), SFM (c), GMM ROC (d), Normalized Gaussian amplitudes for Gaussian 2, 3, 4 (e)
4. TEST RESULTSComparison with manually labeled landmarksVCV utterances ▪ Stops /b/, /d/, /g/, /p/, /t/, /k/ & vowels /a/, /i/, /u/ ▪ 10 speakers (5 F, 5 M)TIMIT sentences ▪ 50 sentences ▪ 5 speakers (3 F, 2 M)
Det. Rates for VCV Utterances 99 98 98 98 96 93 92 93 93 90 83 76 73 64 36
Det. Rates for TIMIT Sentences 98 97 96 95 91 90 90 82 80 71 73 63 45 40 19 Insertions : 13 % (Clicks, glottal stops : 8 %, Vowel-semivowel : 4 %, Stop to /l/, /r/ : 1 %)
5. CONCLUSIONDetection rate obtained using GMM based technique: comparable to other methods at 20-30 ms temporal accuracy, better at 10-15 ms.