Download

1 / 23
230 likes | 310 Views
Explore b-tagging methods and mistag rates in ATLAS data, including tagging efficiency and tracking impacts. Learn about mistag rate evaluation using Monte Carlo simulations and corrections in real data analysis.

E N D
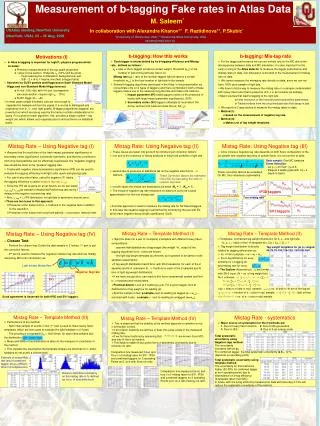
B-tagging Performance Study and Mistag rates in Atlas. M. Saleem (university of Oklahoma) (For Oklahoma Group) Feb. 10, 2009 M. Saleem (University of Oklahoma)
Outline • Introduction • Mistag Rate study • Selection & Data Sample • SV taggers • Performance Study • Ptrel method M. Saleem (University of Oklahoma)
b-tagging overview Definition: Identify a jets which contain a b quark. b-quarks from B-hadrons, which then consequently decays into lighter hadrons (recognized as b jets). To identify these jets one takes advantage of several properties of B-hadrons (long lifetime c= 450 m, travels order of few mm, large mass and momentum fraction of b-hadrons in b-quark jets) which helps to distinguish them from lighter quark jets (known as b-tagging) B-tagging methods used (mostly used in Atlas): Spatial taggers (impact parameters (IP) tag) Secondary Vertex based taggers Soft Lepton tagger – which use the fact that 20% of b-quarks decay semi-leptonically b to c l . 3 M. Saleem (University of Oklahoma) M. Saleem, OU
Mistag rate overview (I) Tagging efficiency: For a jet of a given flavor (light, c, b quark gluon), the tagging efficiency is the ratio of the tagged jets to the number of jets of this particular flavor. Mistagging rate: a ratio of the number of tagged light jets to the total number of light jets in a sample. Tracks with negative impact parameters can be used to evaluate the tagging efficiency from light(uds) quark and gluon(g) jets. For jets of any other flavor, using the negative I.P. tracks, the tagging efficiency is called negative tag rate. Both are/can be known in Monte Carlo; How about real data? The data is a mixture of light (dominant), c- and b-jets; We need methods of b-tagging performance evaluation that work on data. (Later slides) 4 M. Saleem (University of Oklahoma)
Mistag rate overview (II) Major sources that lead to tagging of the light jets: finite resolution of the reconstructed track/vertex parameters Tracks/vertices from the long-lived particles that decay in jets We cannot measure the mistagging rate directly on data because of the presence of b, c jets in an inclusive jet sample Assuming that the resolution of the track impact parameter significance or secondary vertex significance is perfectly symmetric, and that the contribution from long-lived particles can be effectively suppressed, the “negative” tagging rate should be close to the “positive” tagging rate. 5 M. Saleem (University of Oklahoma)
Mistag Rate: The Main Idea (I) • Instead of measuring the positive tagging rate εl, try to measure • the negative tagging rate ( incl) • There are two issues: • Presence of the tracks from long-lived particles (due to residual inefficiency of the V0-filter). • Presence of the tracks from b, c-hadrons in the negative tails in addition to the resolution. • Tevatron: use MC to find correction factors and apply to data. In both cases the correction factors are ~ 1. • The mistagging rate is calculated : __ • SV1 : use vertices with negative normalized distance D; • IP3: use tracks with negative IP, and inverting their IP sign. (From MC) For method to be Reliable We need: Kll ~ 1 ; Khf ~ 1 6 M. Saleem (University of Oklahoma)
SV1 Tagger: Negative tags (I) Event Selection Criteria: Used Release: 13.0.40 Dijet Sample :J2,J3, J4 (as described in the previous slide) Jet PT > 20 GeV ; |Jet eta| < 2.0 ; Require 2 leading jets with >2 (back-to-back). Label b, c, light jets by matching jets with partons after FSR: b jet: a b-quark (Pt > 5 GeV) found in a cone of 0.4 arround the jet axis c jet : a c quark light jet : left jets plus purification (r > 0.8 from the nearest b, c jets) Graph: Sec. Vtx Weights for Pos. and Neg.Tails. Peak weight= -1, corresponds to jets Without Sec. Vtx. 7 M. Saleem (University of Oklahoma)
Ratio of probabilities to find a SV: 2--3 Correction FactorKLL • Conventional Efficiencies are defined: The tagging probability can be split into two factors: probability to find a SV in a jet and probability to tag a jet with a SV the first term accounts for the difference between negative and Positive tags, it is large, of the order of 3 the second term is close to 1 – can be derived from MC Ratio of tagging rates in jets with SV: ~1 KLL • Kllseems to be decreasing at • looser weight cuts. • we believe we can measure this on data, with systematic ~ 10 % (roughly) M. Saleem (University of Oklahoma)
Mistag Rate for SV1 tagger: (I) Correction factor: Khf • We performed the closure test as: • From our definition of Mistag rate: • KHF is closer to 1 for looser. (can be taken from MC) Negative Tag rate (data) Light jet Mistag Rate (Monte Carlo) 9 M. Saleem (University of Oklahoma)
Mistag Rate for SV1 tagger: (II) Comparison of the measured mistag rate (red triangles) to the actual mistag rate (blue dots) known from Monte Carlo. Measured mistag rate is slightly higher. This small discrepancy is under investigation. Summary: Mistag Rate Study: • We have demonstrated the mistag rate study using the SV tagger. • Results are stable and have no depandence on Jet Pt, Jet eta, Jet Multiplicity, No. of Primary Vtx. • Closure test is performed which looks good. • Our study shows that the method adopted to find the mistag rates using SV1 taggers is valid. • Systematic study is also under way. • These results are already compiled in a Atlas note, which is under review process. • Mistag rate study for the IP3D taggers is under way. 10 M. Saleem (University of Oklahoma)
B-tagging Performance Study:Data sets: ttbar seems to be obvious candidate At least two b-jets per event; BUT: Statistics is a problem initially; hard to avoid biasing while selecting a “pure” b-jet sample; low statistics for low-pT jets; di-jets – in this talk Abundant statistics; Huge data sample at low pT; Errors and biases well understood from Tevatron; Good cross check. M. Saleem (University of Oklahoma)
b-enriched sample For the performance study, as m-in-jet sample is used, light jets are dramatically suppressed: 7% c-jets; 3% b-jets Original flavor composition flavor composition requiring m-in-jet M. Saleem (University of Oklahoma)
pT,rel method: description Muons originated from different quark decays have different distributions of pT with respect to the jet axis; Can use templates for b, c and light jets to determine their relative fractions in any sample of muonic jets; MC dependent (b-, c-templates derived from MC) pT,rel templates pT,rel(m), light jets pT,rel(m), c-jets pT,rel(m), b-jets M. Saleem (University of Oklahoma)
Efficiencies by taggers/weights • Fraction of b-jets can be extracted from fitting to templates, before tagging (Fb) and after tagging (Ftagb). • Efficiency is calculated as: Before tagging After tagging (WIP3D+SV1>7) Efficiencies for taggers error bar: di-jet MC data histogram: result of fit M. Saleem (University of Oklahoma)
Tagging efficiency as a function of jet pT / || Good agreement is observed in low pT (<80 GeV) region. In high pT region, the separation of b-template from light and c-template is worse discrepancy. pT,rel systematic errors • Sources of systematic errors: shapes of templates • take 5% change in the b, c pT,rel templates for estimation of the systematic error: 2.5% come from fragmentation model and another 2.5% come from modeling of the lepton momentum spectrum in qX l νldecay. • 3% for light jets considering heavy flavor contamination. • Overall systematic error at the level of 6%; • Expected statistical error (with trigger turn-on) • For Integrated L = 100 pb-1 data, overall statistical error well below 1%. Red dot: MC true efficiency, blue square: measured efficiency. Good agreement is observed in the whole || region. This work is published as: Atlas NOTE : CERN-OPEN-2008-020 ; arXiv:0901.0512 M. Saleem (University of Oklahoma)
The End M. Saleem (University of Oklahoma)
IP Based b-tagging algorithm (I) • Definition of Signed I.P. • Distance of closest approach to the primaryVertex (P.V.) • d0 and Z0: track impact parameter in transverse (r- ) • and in longitudinal (r-z) plane. • Select the tracks based on pre-defined track grade (called good tracks). • For each good charged track: • Obtain signed impact parameter (d0 or Z0) • Obtain the significance: S = d0/(d0) and z0/(z0) • Calculate the track weight Wtrack = b(S)/u(S) ; b(S) and u(S) are PDF’s for b-quark and u-qurak jet respectively. • PDF:probability density function for a jet to be a of type (b or light). • Jet weight: WIPJet = i=1 ln(Wtrack_i) ; Wtrack_i = b(Si)/u(Si) Note : IP is a signed quantity w.r.t to jet axis (so is S(IP)) : - positive if q < p/2 - negative if q > p/2 Jet Axis Track 18 M. Saleem (University of Oklahoma) M. Saleem, OU
IP Based b-tagging algorithm (II) S(IP)/(S(IP)) Noramlized distribution Feed to PDF’s for b-jet b(s)and light jet u(s) Ntrack WIPJet = i=1 ln[b(si)/u(si)] • Algorithm’s based on IP Taggers: • IPxD (x=1,2,3) • Jet Prob: d0/(d0) of each track compared to the resolution func. Of the prompt track obtained from data using negative side of SIP. • IP2D (d0): • IP3D (d0 + z0 : 2D Pdf): Rejection = 1/light = 46 @ b = 60 % Rejection = 1/light = 67 @ b = 60 % Rejection = 1/light = 30 @ b = 60 % M. Saleem (University of Oklahoma) M. Saleem, OU 19
Secondary Vertex (SV) tagger (I) • Among the selected tracks (tracks associated to jet), find and remove the tracks from (Ko) decay, conversion and material interaction. • Remaining tracks are combined and try to fit them into one Sec. Vtx., If the fit to 2 is not acceptable, remove the tracks with highest contribution until 2 is acceptable. • Variables such as: (not to co-relate with the track impact parameter: e.g; distance between PV and SV are highly co-related, so use some other variables) • N: No. of good 2 tracks vertices in the jet • M: invariant mass of all particles in the secondary vertex • F: Energy Fraction (E svx /E jet). 20 M. Saleem (University of Oklahoma) M. Saleem, OU
Data samples • We used the following data samples: • J2 : ~198 K events • Energy range: 35 – 70 GeV • Reconstruction Version: 13.0.30.2 • J3 : ~586K events • Energy range: 70 – 140 GeV • Reconstruction Version: 13.0.30.2 • J4 : ~300K events • Energy range: 140 – 280 GeV • Reconstruction Version: 13.0.30.2 11/12/2008 21 M. Saleem (University of Oklahoma) M. Saleem, OU
Monte Carlo samples/Methods Monte Carlo di-jet samples: Standard di-jet data for trigger studies. m-in-jet data (3 GeV muon pT cut in Muon Filter) for performance studies; Methods: System8 (basic); pT,rel (cross check). Both methods rely on presence of a muon in the jet! M. Saleem (University of Oklahoma)
Triggers for b-tagging studies L2_mu4_J10/50 L2_mu4_J18/15 L2_mu4_J23/12 L2_mu4_J35/12 L2_mu4_J42/1 L2_mu4_J10 Combination of existing triggers, single muon trigger and jet trigger new triggers; LVL1 trigger: L1_MU4_J10 implemented; LVL2 trigger: sum of L2_mu4_J10, L2_mu4_J18, L2_mu4_J23, L2_mu4_J35, L2_mu4_J42. M. Saleem (University of Oklahoma)