Download
1 / 22
220 likes | 223 Views
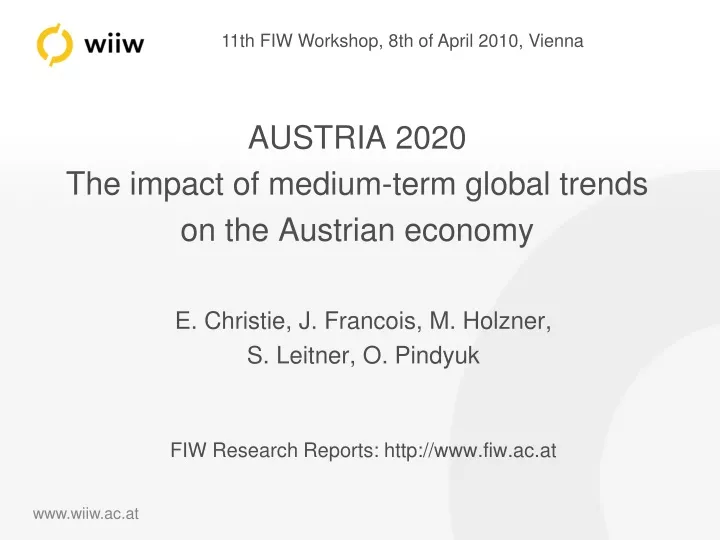
AUSTRIA 2020 The impact of medium-term global trends on the Austrian economy. E. Christie, J. Francois, M. Holzner, S. Leitner, O. Pindyuk FIW Research Reports: http://www.fiw.ac.at. Contents. Overview of Austria’s Current Economic Structure Overview of Macroeconomic Projections

E N D
AUSTRIA 2020The impact of medium-term global trends on the Austrian economy E. Christie, J. Francois, M. Holzner, S. Leitner, O. Pindyuk FIW Research Reports: http://www.fiw.ac.at
Contents • Overview of Austria’s Current Economic Structure • Overview of Macroeconomic Projections • Structural Change in Austria • Household Inequality in Austria
Structure of the Austrian economy, 2008 Source: GTAP, wiiw calculations. * Rank 1 means the highest ratio. [1] Coal, gas and oil sectors were excluded from this analysis due to their low shares in the total value added.
Structure of Austria’s value added, exports and imports, %, and ranks* of industries by capital-labor ratios and ratios of skilled labor to unskilled labor in total costs in 2008[1] Coefficients of correlation between Austria and other regions Source: CGE projection-based estimates [1] Coal, gas and oil sectors were excluded from this analysis due to their low shares in the total value added.
Structure of Austria’s value added, exports and imports, %, and ranks* of industries by capital-labor ratios and ratios of skilled labor to unskilled labor in total costs in 2008[1] Geographical structure of Austrian trade in 2008, % Source: CGE projection-based estimates [1] Coal, gas and oil sectors were excluded from this analysis due to their low shares in the total value added.
Model Multi-region CGE model with imperfect competition Basic database is built from the GTAP7 database (benchmarked to 2004) 32 sectors, 16 regions Exogenous variables: GDP, population, skilled and unskilled labor, energy prices, TFP in primary food production sector
Structure of Austria’s value added, exports and imports, %, and ranks* of industries by capital-labor ratios and ratios of skilled labor to unskilled labor in total costs in 2008[1] Regional Aggregation Scheme [1] Coal, gas and oil sectors were excluded from this analysis due to their low shares in the total value added.
Structure of Austria’s value added, exports and imports, %, and ranks* of industries by capital-labor ratios and ratios of skilled labor to unskilled labor in total costs in 2008[1] Regional Shares of Global GDP: 2008 & 2020 Source: CGE projection-based estimates [1] Coal, gas and oil sectors were excluded from this analysis due to their low shares in the total value added.
Structure of Austria’s value added, exports and imports, %, and ranks* of industries by capital-labor ratios and ratios of skilled labor to unskilled labor in total costs in 2008[1] Population and labor force growth source: IMF WEO, Eurostat [1] Coal, gas and oil sectors were excluded from this analysis due to their low shares in the total value added.
Structure of Austria’s value added, exports and imports, %, and ranks* of industries by capital-labor ratios and ratios of skilled labor to unskilled labor in total costs in 2008[1] Energy price trends in the 2008-2020 baseline Source: World Bank Pink Sheets and IEA, and industry projections. Cumulative increases in physical capital and TFP: 2008-2020 Source: CGE projection-based estimates [1] Coal, gas and oil sectors were excluded from this analysis due to their low shares in the total value added.
Structure of Austria’s value added, exports and imports, %, and ranks* of industries by capital-labor ratios and ratios of skilled labor to unskilled labor in total costs in 2008[1] Regional Shares of Global Output by Gross Value: 2008 & 2020 Source: CGE projection-based estimates [1] Coal, gas and oil sectors were excluded from this analysis due to their low shares in the total value added.
Structure of Austria’s value added, exports and imports, %, and ranks* of industries by capital-labor ratios and ratios of skilled labor to unskilled labor in total costs in 2008[1] Regional Shares of Global Exports by Value: 2008 & 2020 Source: CGE projection-based estimates [1] Coal, gas and oil sectors were excluded from this analysis due to their low shares in the total value added.
Structure of Austria’s value added, exports and imports, %, and ranks* of industries by capital-labor ratios and ratios of skilled labor to unskilled labor in total costs in 2008[1] Regional Shares of Global Imports by Value: 2008 & 2020 Source: CGE projection-based estimates [1] Coal, gas and oil sectors were excluded from this analysis due to their low shares in the total value added.
Cumulative % increases in real global commodity prices: 2008-2020 Source: World Bank Pink Sheets and IEA, and industry projections (for energy), and CGE model projections (for other).
Changes in CAB, annual position, EUR mn, 2020 relative to 2008 Source: CGE projection-based estimates
Change in the real output, value of exports and imports in Austria over 2008-2020, % Source: CGE projection-based estimates.
Net exports, %GDP Source: CGE projection-based estimates
Structure of Austria’s value added, exports and imports, %, and ranks* of industries by capital-labor ratios and ratios of skilled labor to unskilled labor in total costs in 2008[1] Regional Shares of Austrian Exports by value: 1992, 2008, & 2020 Europe 83.2% Europe 72.9% Europe 67.8% Source: CGE projection-based estimates [1] Coal, gas and oil sectors were excluded from this analysis due to their low shares in the total value added.
Structure of Austria’s value added, exports and imports, %, and ranks* of industries by capital-labor ratios and ratios of skilled labor to unskilled labor in total costs in 2008[1] Regional Shares of Austrian Imports by value: 1992, 2008, & 2020 Europe 83.0% Europe 76.3% Europe 68.8% Source: CGE projection-based estimates [1] Coal, gas and oil sectors were excluded from this analysis due to their low shares in the total value added.
Household Inequality in Austria Stylised fact: Austria a winner of internationalisation but average wage earner did not participate in gains Literature: only few studies on distributional trade effects in Austria & no multi-country CGE analysis Assumption 2020: unskilled labour -7%, skilled labour +23% (CEDEFOP), population growth 5% GTAP input 2020: factor income for unskilled +11%, skilled +18%, capital +22% Mapping exercise: regression based assignment of inactive to labour force using EU-SILC micro data
Mapping exercise results Income shares: skilled vs. unskilled labour income ratio increases from 37/63 to 48/52 by 2020 Average income: skilled -5%, unskilled +33% due to changes in the number of persons Gini coefficient: Initial 27.5, changes in skilled vs unskilled increases to 28.3, higher capital income increases to 28.5, below average increase of transfers reduces inequality only to 28.1 in 2020 Policy: Compensation of groups being relatively worse off, increasing capital and high income taxation
AUSTRIA 2020The impact of medium-term global trends on the Austrian economy E. Christie, J. Francois, M. Holzner, S. Leitner, O. Pindyuk FIW Research Reports: http://www.fiw.ac.at