Download
1 / 1

E N D
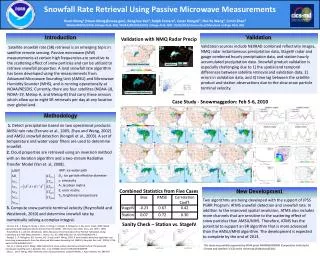
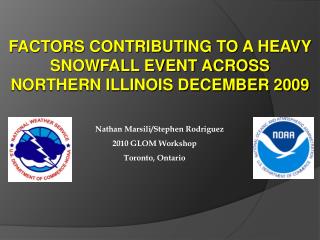
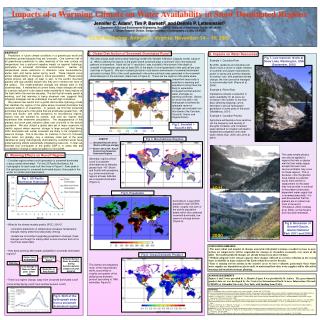
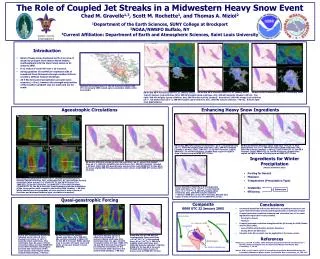
The Role of Coupled Jet Streaks in a Midwestern Heavy Snow EventChad M. Gravelle1,3, Scott M. Rochette1, and Thomas A. Niziol21Department of the Earth Sciences, SUNY College at Brockport2NOAA/NWSFO Buffalo, NY3Current Affiliation: Department of Earth and Atmospheric Sciences, Saint Louis University Introduction • Band of heavy snow developed north of an area of weak low pressure from eastern North Dakota southeastward into the lower Great Lakes on 21 January 2005. • 8-12 inches of snow fell over a 12-h period. • Strong gradient of snowfall on southwest side of snowband from Minnesota through northern Illinois created a difficult forecast challenge. • 24-h Eta forecast of precipitation amounts were accurate (~ 8 in.), however the strength and position of the southern gradient was too weak and too far south. Isohyets of snowfall (in.) for the 24-h period ending 1200 UTC 22 January 2005, based upon cooperative station data from NCDC. 80 km Eta 00-h forecast (1200 UTC 21 January 2005) 80 km Eta 06-h forecast (1800 UTC 21 January 2005) 80 km Eta 00-h forecast (0000 UTC 22 January 2005) Top left: Isobars (red solid lines, hPa), 300-hPa heights (pink solid lines, dm), 300-hPa Isotachs (shaded >90 kts). Top right: 500-hPa heights (green solidlines, dm), 500-hPa abs vorticity (shaded). Bottom left: 500-hPa omega (red solid lines μb s-1, red dashed lines μb s-1), 300-hPa heights (pink solid lines, dm), 300-hPa isotachs (shaded > 90 kts). Bottom right: 2 km WSI NOWrad. Ageostrophic Circulations Enhancing Heavy Snow Ingredients a b ~1900 km ~1570 km 80 km Eta 500-hPa omega (red solid lines -μb s-1, red dashed lines μb s-1), 300-hPa heights (pink solid lines, dm), 300-hPa isotachs (shaded > 90 kts): (left) 1200 UTC 21 Jan 00-h forecast, (right) 0000 UTC 22 Jan 00-h forecast. Shaded blue region on right is Area of heavy snow at 0000 UTC 22 Jan. 80 km Eta 850 θe advection (blue solid lines +K 12 h-1), blue dashed lines -K 12 h-1), 300-hPa heights (pink solid lines, dm), 300-hPa isotachs (shaded > 90 kts): (left) 1200 UTC 21 Jan 00-h forecast, (right) 0000 UTC 22 Jan 00-h forecast. Shaded blue region on right is area of heavy snow at 0000 UTC 22 Jan. c d Ingredients for Winter Precipitation 80 km Eta 500-hPa omega (green/red solid lines -μb s-1, green/red dashed lines μb s-1), 300-hPa heights (pink solid lines, dm), 300-hPa isotachs (shaded > 90 kts): (left) 300-hPa ageostrophic wind vectors (red) 0000 UTC 22 Jan 00-h forecast, (right) 850-hPa ageostrophic wind vectors (red) 0000 UTC 22 Jan 00-h forecast. ~1400 km (Wetzel and Martin 2001) ~970 km • Forcing for Ascent • Moisture • Temperature (Precipitation Type) • Instability • Efficiency Eta omega (shaded warm colors -μb s-1, shaded cool colors μb s-1), isotachs (black solid lines, kts), isentropes (tan, K), ageostrophic vertical circulation (blue arrows): (a) 1200 UTC 21 Jan 00-h forecast, (b) 1800 UTC 21 Jan 06-h forecast, (c) 0000 UTC 22 Jan 00-h forecast, (d) 0600 UTC 22 Jan 06-h forecast. Inset figures provide the orientation of the cross-section with respect to the isotach field (shaded, > 90 kts). White shaded area in topography of cross-section is area of snow at that time and distance between ageo circulations is marked. 80 km Eta 850 to 500-hPa 2-D frontogenesis (pink solid lines +K m-1 10-10 s-1), pink dashed lines - K m-1 10-10 s-1), 300-hPa heights (blue solid lines, dm), 300-hPa isotachs (shaded > 90 kts): 0000 UTC 22 Jan 00-h forecast. Shaded blue region is area of heavy snow at 0000 UTC 22 Jan. Enhancers Quasi-geostrophic Forcing Conclusions • Snowband intensified and became defined as ascending branches of two upper-level jet streaks and associated ageostrophic circulations merged. • Coupled jet streak circulation enhanced and intensified two of the main ingredients required for heavy snowfall. - Forcing for Ascent - Moisture • Coupled jet streak circulation strengthened the QG forcing for UVM (Hakim and Uccellini 1992). - Area of Differential Positive Vorticity Advection - Strong Warm Air Advection • Synoptic scale QG concepts may be applicable in the meso-αscale. References Hakim, G.J., and L.W. Uccellini, 1992: Diagnosing Coupled Jet-Streak Circulations for a Northern Plains Snow Band from the Operational Nested-Grid Model. Wea. Forecasting., 7, 26-48. Wetzel, S.W., and J.E. Martin, 2001: An Operational Ingredients-Based Methodology for Forecasting Midlatitude Winter Season Precipitation. Wea. Forecasting., 16, 156-167. Composite 0000 UTC 22 January 2005 80 km Eta temperature advection (shaded warm colors K 12 h-1, shaded cool colors –K 12 h-1), isotachs (black solid lines, kts), isentropes (tan, K), ageo vertical circulation (blue arrows): 0000 UTC 22 Jan 00-h forecast. Inset figure provides the orientation of the cross-section with respect to the isotach field (shaded, > 90 kts). 80 km Eta 500-hPa heights (green solid lines, dm), 500-hPa abs vorticity (shaded ): 0000 UTC 22 Jan 00-h forecast. White shaded area is location of heavy snow and white arrows are the jet cores at 300-hPa. 80 km Eta positive vorticity advection (shaded 10-9 s-1), isotachs (black solid lines, kts), isentropes (tan, K), ageo vertical circulation (blue arrows): 0000 UTC 22 Jan 00-h forecast. Inset figure provides the orientation of the cross-section with respect to the isotach field (shaded, > 90 kts). 80km Eta 925 to 700-hPa QG frontogenesis (blue solid lines +K2 m-2 10-15 s-1), blue dashed lines -K2 m-2 10-15 s-1), 300-hPa heights (pink solid lines, dm), 300-hPa isotachs (shaded > 90 kts): 0000 UTC 22 Jan 00-h forecast. Shaded blue region is area of heavy snow at 0000 UTC 22 Jan.