Download
1 / 23
230 likes | 365 Views
NATS 101 Lecture 15 Surface and Upper-Air Maps. Supplemental References for Today’s Lecture. Gedzelman, S. D., 1980: The Science and Wonders of the Atmosphere . 535 pp. John-Wiley & Sons. (ISBN 0-471-02972-6). Summary. Because horizontal pressure differences are the force that drives the wind

E N D
Supplemental References for Today’s Lecture Gedzelman, S. D., 1980: The Science and Wonders of the Atmosphere. 535 pp. John-Wiley & Sons. (ISBN 0-471-02972-6)
Summary • Because horizontal pressure differences are the force that drives the wind Station pressures are adjusted to one standard level…Mean Sea Level…to mitigate the impact of different elevations on pressure
PGF Ahrens, Fig. 6.7
Correction for Phoenix Elevation of PHX Airport is ~340 m Station pressure at PHX was ~977 mb So, SLP for PHX would be SLP =977 mb + (1 mb / 10 m)340 m SLP =977 mb + 34 mb = 1011 mb
Surface Maps • Pressure reduced to Mean Sea Level is plotted and analyzed for surface maps. Estimated from station pressures • Actual surface observations for other weather elements (e.g. temperatures, dew points, winds, etc.) are plotted on surface maps. NCEP/HPC Daily Weather Map
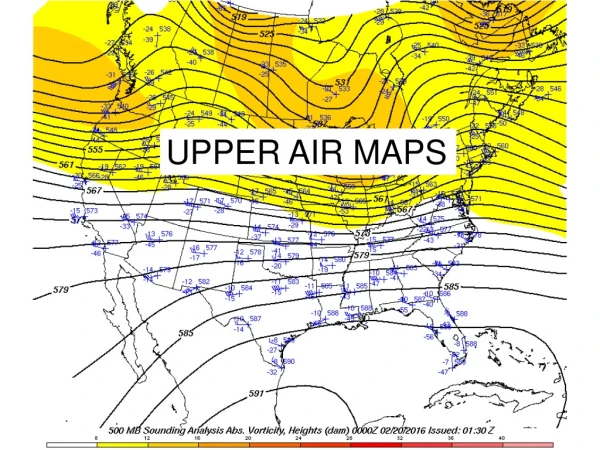
Isobaric Maps • Weather maps at upper levels are analyzed on isobaric (constant pressure) surfaces. (Isobaric surfaces are used for mathematical reasons that are too complex to explain in this course!) • Isobaric maps provide the same information as constant height maps, such as: Low heights on isobaric surfaces correspond to low pressures on constant height surfaces! Cold temps on isobaric surfaces correspond to cold temperatures on constant height surfaces!
(Constant height) Downhill 496 mb PGF 504 mb Ahrens, Fig. 2, p141 Isobaric Maps Some generalities: 1) High/Low heights on an isobar surface correspond to High/Low pressures on a constant height surface 2) Warm/Cold temps on an isobaric surface correspond to Warm/Cold temps on a constant height surface 3) The PGF on an isobaric surface corresponds to the downhill direction
Contour MapsHow we display atmospheric fields Portray undulations of 3D surface on 2D map A familiar example is aUSGS Topographic Map It’s a useful way to display atmospheric quantities such astemperatures, dew points, pressures, wind speeds, etc. Gedlezman, p15
https://www.e-education.psu.edu/gened/meteo101/Examples/Section2p02.htmlhttps://www.e-education.psu.edu/gened/meteo101/Examples/Section2p02.html Click “interactive exercise” https://www.e-education.psu.edu/gened/meteo101/Examples/Section2p03.html https://www.e-education.psu.edu/gened/meteo101/Examples/Section2p04.html Click “interactive isotherm map” From Contour Maps Online Picture “To successfully isopleth the 50-degree isotherm, imagine that you're a competitor in a roller-blading contest and that you're wearing number "50". You can win the contest only if you roller-blade through gates marked by a flag numbered slightly less than than 50 and a flag numbered slightly greater than 50.”
Region of Low Heights TROUGH and Cold Region of High Heights RIDGE and Warmth Height contours Temps shaded
PGF Wind
Key Concepts for Today • Station Pressure and Surface Analyses Reduced to Mean Sea Level Pressure (SLP) PGF Corresponds to Pressure Differences • Upper-Air Maps On Isobaric (Constant Pressure) Surfaces PGF Corresponds to Height Sloping Downhill • Contour Analysis Surface Maps-Analyze Isobars of SLP Upper Air Maps-Analyze Height Contours
Key Concepts for Today • Wind Direction and PGF Winds more than 1 to 2 km above the ground are perpendicular to PGF! Analogous a marble rolling not downhill, but at a constant elevation with lower altitudes to the left of the marble’s direction
Assignment Topic – Newton’s Laws Reading -Ahrens pg 150-157 Problems -6.12, 6.13, 6.17, 6.19, 6.22