Download
1 / 22
280 likes | 783 Views
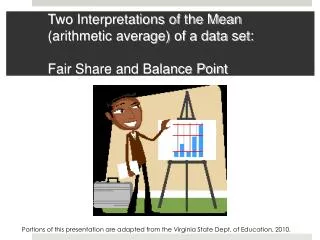
Mean as Fair Share and Balance Point VMSTC November 8, 2010. Mean: Fair Share and Balance Point. Mean: Fair Share. 2009 5.16: The student will a) describe mean, median, and mode as measures of center ; b) describe mean as fair share ;

E N D
Mean as Fair Share and Balance Point • VMSTC • November 8, 2010
Mean: Fair Share 2009 5.16: The student will a) describe mean, median, and mode as measures of center; b) describe mean as fair share; c) find the mean, median, mode, and range of a set of data; and d) describe the range of a set of data as a measure of variation. Understanding the Standard: “Mean represents a fair share concept of the data. Dividing the data constitutes a fair share. This is done by equally dividing the data points. This should be demonstrated visually and with manipulatives.”
Understanding the Mean • Each person at the table should: • Grab one handful of snap cubes. • Count them and write the number on a sticky note. • Snap the cubes together to form a train.
Understanding the Mean Work together at your table to answer the following question: If you redistributed all of the cubes from your handfuls so that everyone had the same amount (so that they were “shared fairly”), how many cubes would each person receive?
Understanding the Mean What was your answer? - How did you handle “leftovers”? - Add up all of the numbers from the original handfuls and divide the sum by the number of people at the table. - Did you get the same result? - What does your answer represent?
Understanding the Mean Take your sticky note and place it on the wall, so they are ordered… Horizontally: Low to high, left to right; leave one space if there is a missing number. Vertically:If your number is already on the wall, place your sticky note in the next open space above that number.
Understanding the Mean How did we display our data? 2009 3.17c
Understanding the Mean Looking at our line plot, how can we describe our data set? How can we use our line plot to: - Find the range? - Find the mode? - Find the median? - Find the mean?
Mean: Balance Point 2009 6.15: The student will a) describe mean as balance point; and b) decide which measure of center is appropriate for a given purpose. Understanding the Standard: “Mean can be defined as the point on a number line where the data distribution is balanced. This means that the sum of the distances from the mean of all the points above the mean is equal to the sum of the distances of all the data points below the mean.” • Essential Knowledge & Skills: • Identify and draw a number line that demonstrates the • concept of mean as balance point for a set of data.
Where is the balance point for this data set? X X X X X X
Where is the balance point for this data set? X X X X X X
Where is the balance point for this data set? X X X X X X
Where is the balance point for this data set? X X X X X X
Where is the balance point for this data set? 3 is the Balance Point X X X X X X
Where is the balance point for this data set? MEAN Sum of the distances below the mean 1+1+1+2 = 5 Sum of the distances above the mean 2 + 3 = 5 X X X X X X
Where is the balance point for this data set? Move 2 Steps Move 2 Steps Move 2 Steps Move 2 Steps 4 is the Balance Point 17
We can confirm this by calculating: 2 + 2 + 2 + 3 + 3 + 4 + 5 + 7 + 8 = 36 36 ÷ 9 = 4 The Mean is the Balance Point 18
Where is the balance point for this data set? If we could “zoom in” on the space between 10 and 11, we could continue this process to arrive at a decimal value for the balance point. Move 1 Step The Balance Point is between 10 and 11 (closer to 10). Move 2 Steps Move 1 Step Move 2 Steps 19
Mean: Balance Point • When demonstrating finding the balance point: • CHOOSE YOUR DEMONSTRATION DATA SETS INTENTIONALLY. • Use a line plot to represent the data set. • Begin with the extreme data points. • Balance the moves, moving one data point from each side an equal number of steps toward the center. • Continue until the data is distributed symmetrically or until there are only two values left on the line plot.
Assessing Higher-Level Thinking Key Points for 2009 5.16 & 6.15: Students still need to be able to calculate the mean by summing up and dividing, but they also need to understand: - why it’s calculated this way (“fair share”); - how the mean compares to the median and the mode for describing the center of a data set; and - when each measure of center might be used to represent a data set.
Mean:Fair Share & Balance Point “Students need to understand that the mean ‘evens out’ or ‘balances’ a set of data and that the median identifies the ‘middle’ of a data set. They should compare the utility of the mean and the median as measures of center for different data sets. …students often fail to apprehend many subtle aspects of the mean as a measure of center. Thus,the teacher has an important role in providing experiences that help students construct a solid understanding of the mean and its relation to other measures of center.” - NCTM Principles & Standards for School Mathematics, p. 250