Download

1 / 40
400 likes | 534 Views
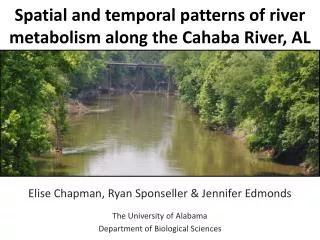
Exploring Community Dynamics of Denitrifying Bacteria in the Cahaba River. Corianne Tatariw, Elise Chapman, Dr. Jennifer Edmonds. Department of Biological Sciences University of Alabama, Tuscaloosa. Effects of N-loading. Acidification/ eutrophication of freshwater systems

E N D
Exploring Community Dynamics of Denitrifying Bacteria in the Cahaba River Corianne Tatariw, Elise Chapman, Dr. Jennifer Edmonds Department of Biological Sciences University of Alabama, Tuscaloosa
Effects of N-loading • Acidification/ eutrophication of freshwater systems • Loss of biodiversity • Harmful algal blooms • Eutrophication/ hypoxia in coastal systems Images from NOAA
Goal: evaluate denitrification as a meaningful nitrate sink in large rivers How does denitrifier community structure respond to environmental parameters? What is the effect of these changes in denitrifier community structure on rates of denitrification?
Ecosystem Function and Diversity High diversity of microorganisms suggests functional redundancy, but… Denitrifier communities respond differently to environmental conditions, affecting rates of denitrification (Cavigelli and Robertson 2000)
NO3-NO2- NO N2O N2 nirS /nirK gas • Heterotrophic facultative anaerobes • Dissolved Oxygen (DO) affects distribution of nirS and nirK denitrifiers (Graham et al 2010, Knapp et al 2009) • nirK denitrifiers can function under fluctuating DO conditions • nirS denitrifiers found in consistently anoxic environments
Sediment Particle Size • Measured as porosity: Fraction of void space in a volume of sediment • Greater surface area: volume in smaller sediments • Affects movement of DO through sediment
The Cahaba River VR FL CP Valley Ridge (VR) Coastal Plain (CP) Fall Line (FL)
Birmingham The Cahaba River: A Nitrate Sink
How does denitrifier community composition change over space and time? • NirS and nirK denitrifiers will have distinct community structures within each geophysical province due to changes in sediment size and channel slope. • Dominance of nirS vs. nirK will vary due to spatial and seasonal variations in DO
Methods • Three subsamples taken from homogenized sediment in field • Spring, Early Summer, Late Summer, Winter • 2 locations per geophysical province (VR, FL, CP) • TRFLP of nirS and nirK • nirS: cd3aF/R3cd-HEX • nirK: FlaCu-FAM/R3Cu • Restriction enzyme: MspI • Analysis of Similarity: Primer v.6
ANOSIM: nirS 2D Stress = 0.14 • No significant difference by geophysical province or date • nirS dominates in anoxic environments which may have less variable conditions Valley Ridge Fall Line Coastal Plain Global R = 0.157 p = 0.03
ANOSIM: nirK • Coastal Plain different from Valley Ridge and Fall Line • No significant seasonal difference • CP has finer, sandy substrate compared to VR and FL 2D Stress = 0.22 Global R = 0.223 p = 0.001 Valley Ridge Fall Line Coastal Plain
How do rates of denitrification vary over time and space in the Cahaba River? • Denitrification rates will vary among geophysical provinces in response to changes in denitrifier community composition. • Highest rates of denitrification will coincide with high primary productivity as carbon limitation is alleviated
Methods • Sediment samples collected with microbial samples • Acetylene block method to measure denitrification potential rates
DenitrificationPotentialRates p <0.05 b ab ab Denitrification Rate (mmol N2 g-1 hr-1) a
Implications The Cahaba River is a sink for NO3- Lack of relationship between changes in community composition and denitrification rates suggests functional redundancy
Acknowledgements Committee Members Dr. Jennifer Edmonds Dr. Robert Findlay Dr. Lisa Davis Lab Members Elise Chapman Courtney Dragiff Susan Jozefiak Ben Wilson Field and Lab Help Chau Tran Julie Jarnigan Diane Schneider Marie Wilson
ANOSIM:16S rDNA at Fall Line 1 2D Stress = 0.16 • Bacterial community structure changes over time through macrophyte growing season 2 June 2010 14 July 2010 24 June 2010 Global R = 0.414 p = 0.001
Nitrogen and Carbon Response: Winter/Spring * Dec. 2010 DNP (nmol N2 g-1 hr-1) Apr. 2011 DNP (nmol N2 g-1 hr-1) * Statistically significantly different from ambient denitrification potential rate; p=0.05
The Cahaba River: An N Sink? Fall Line
Humans and Nitrogen • Estimated deposition of reactive nitrogen in a) 1890s and b) 1990s • Fertilizer • Leguminous crops • Livestock • Fossil fuel combustion Galloway et al. 2004. Biogeochemistry70: 153-266
Microbially Mediated N-removal Burgin and Hamilton. 2007. Front Ecol. Environ. 5: 89-96
Nitrite Reductase Functional Genes nirK: Areas of DO flux, more active at night nirS: Consistently anoxic environments, always active Nitrite reductase cytochrome-cd1 Nurizzo et al. 1998. Biochemistry 37:13987-13996. Copper-containingnitrite reductase Nojiri et al. 2007. PNAS. 104: 4315-4320.
Summary of DNP Data • Denitrification is occurring along the Cahaba at rates comparable to those in literature (Piña-Ochoa and Álvarez-Cobelas 2006) • Highest rates occurred at the Fall Line in summer • Lack of C response suggests in-stream primary producers alleviated C-limitation • Spatial heterogeneity at Fall Line
C and N Limitation – June 2010 Denitrification Potential (nmol N2 g-1 hr-1)
C and N Limitation – Sept 2010 * * * * * * * Significantly different from ambient DNP rate; p <0.05
Future Work 1) Denitrification potential rate measurements in April 2011 will be highest at the Fall Line 1) How do rates of denitrification vary in the Cahaba River? 2) How does denitrifier community composition change over space and time? 2) T-RFLP of nirS and nirK functional genes will show distinct denitrifier community structure at the scale of geophysical province. 3) How does denitrifier activity and abundance change over space and time? 3) qPCR of nirS and nirK will show increased denitrifier activity and abundance associated with higher denitrification rates and there will be changes in nirS vs. nirK activity over space and time.
Large and unregulated • North of Birmingham to Selma, AL • Confluence with Alabama River • Valley Ridge, Fall Line, Coastal Plain
Research Questions • How do rates of denitrification vary in the Cahaba River? 2) How does denitrifier community composition change over space and time? 3) How does denitrifier activity and abundance change over space and time? • Denitrification in streams receiving large inputs of NO3- is limited by organic carbon lability. • Primary producer distribution will control denitrification longitudinally. • Seasonal changes in labile OC availability will affect rates of denitrification.
Testing for C and N Saturation Coastal Plain Site 2 – Dec 2010 Denitrification Potential (nmol N2 g-1 hr-1) NO3- Concentration Added (mmol)
Testing for C and N Saturation Fall Line Site 2 – Dec 2010 Denitrification Potential (nmol N2 g-1 hr-1) NO3- Concentration Added (mmol)
-Delivery of NO3- to subsurface influenced by geomorphology (Böhlke et al. 2009) • -Competition with in-stream primary producers
Nitrogen and Carbon Response * * Fall Line LateSummer DNP (nmol N2 g-1 hr-1) Early Summer No significant response to nitrogen or carbon (p=0.05) Late Summer FL1: Middle of Fall Line, macrophyte-dominated shoals F2: Bottom of Fall Line, transition to Coastal Plain DNP (nmol N2 g-1 hr-1) * Statistically significantly different from ambient denitrification potential rate; p=0.01, 0.02