Download
1 / 46
460 likes | 604 Views
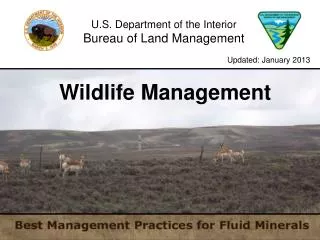
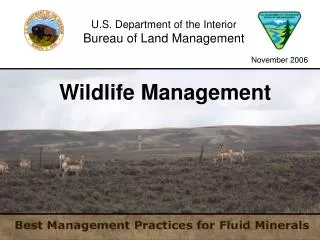
U.S. Department of the Interior Bureau of Land Management. Updated 05-09-2011. Air Resource BMPs. www.blm.gov/bmp. Protection of Air Resources.

E N D
U.S. Department of the Interior Bureau of Land Management Updated 05-09-2011 Air Resource BMPs www.blm.gov/bmp
Protection of Air Resources • This slide show identifies a range of typical Best Management Practices (BMP) for protecting air resources during oil and gas development and production operations. • This is a partial list. For additional Air Resource BMPs and more detailed technical and investment-payback information, please visit the websites listed in this presentation. Nothing in this presentation is an endorsement of a particular company, product , or service.
Using BMPs to Reduce Emissions What types of emissions can be reduced? • Hazardous Air Pollutants (HAPs) – Can Cause Serious Health Problems • Benzene, Toluene, Xylene, Formaldehyde • Criteria Pollutants – National Standards to Protect Health and Welfare • PM10 (Dust), PM2.5, Carbon Monoxide, Sulfur dioxide, Ozone, Nitrogen Oxides • Volatile Organic Compounds (VOCs) – Contribute to Ozone Formation • Propane, Butane, Pentane, Hexanes, Octanes, etc. • Greenhouse Gases (GHGs) – Contribute to Climate Change • Carbon dioxide (CO2), Methane (CH4), Nitrous Oxide (N2O)
Using BMPs to Reduce Emissions Where Do Emissions Come From? • Combustion Emissions: Include Criteria Pollutants, VOCs, GHGs, HAPs. • Come from: Vehicle Tailpipe Exhaust Emissions, Dehydrators, Mobile and Stationary Engines, Flaring • Fugitive Emissions: Include Criteria Pollutants, VOCs, HAPs, GHGs • Equipment Leaks, Evaporation Ponds and Pits, Condensate Tanks, Storage Tanks, Windblown Dust (from Truck and Construction Activity) • Vented Emissions: Include GHGs, VOCs, HAPs • Dehydrator Vents
Part 1Air Resource BMPsTransport Reducing trucking and service traffic can reduce associated dust and tailpipe emissions.
Directional Drilling Using directional drilling to drill multiple wells from a single well pad, rather than constructing an equal number of separate roads and well pads. Sixteen Wells on this Well Pad • Benefits – • Reduces road & pad construction- • related dust and emissions. • Reduces road network. • Reduces truck traffic dust and emissions. Efficiency Drilling Rig
Centralized Water Storage and Delivery Using centrally stored water that is piped to the well pads and fracturing facilities through a temporary, plastic, surface line. Benefits – Reduces Water Hauling Truck Trips and Decreases Associated Dust and Tailpipe Emissions Temporary Water Line vs. Truck Transport
Centralized Fracturing Using centralized fracturing pads with hard-line frac pipes, some running over one mile, that can serve many well pads - representing hundreds of wells in all. Benefits – Reduces Water Hauling Truck Trips and Decreases Associated Dust and Tailpipe Emissions Water line Frac pad
Off Site Centralization of Production and Use of Liquids Gathering Systems Using Liquids Gathering Systems to collect and pipe produced fluids from each remote well location to a Centralized Production and Collection Facility situated more closely to a major county or State highway. Benefits – Centralization creates fewer emissions sources and makes it more efficient to control emissions. Reduces Haul Truck Trips and Decreases Associated Dust and tailpipe emissions.
Telemetry & Well Automation Using telemetry to remotely monitor & control production. Benefits – Reduces Service Truck Traffic and Decreases Associated Dust and Tailpipe Emissions
Fugitive Dust ControlReducing Fugitive Dust From Vehicle Traffic Dust affects air quality and creates a health and visibility safety hazard for drivers.
Dust Control Suppression vs. Prevention • Water • Low Initial Cost • Recurring Hourly Maintenance • Increased Vehicle Emissions • Lasts Hours • Chip-Seal or Asphalt • High or Very High Initial Cost • Lasts Several or Many Years • More Cost-effective for Roads • with Higher Average Daily • Traffic
Dust Control • Dust Suppressants • Such as: • Magnesium Chloride, Calcium Chloride, Lignin Sulfonate, Asphalt Emulsion • Moderate Initial Cost • Lasts About 1 Year • Good For Low Traffic • Roads • Check with local authorities regarding allowable use.
Dust Control - Example Dust Suppressant – good reduction in dust Dust trail still visible where there was no treatment
Dust Reduction Using Reduced Vehicle Speeds to Decrease Fugitive Dust on Roads with High Traffic and High Dust Potential.
Vanpooling Using vans and buses to shuttle employees to the worksite, thereby reducing the number of vehicle trips Benefits – Reduced tailpipe emissions and dust.
Cleaner Diesel Power Moving toward cleaner diesel engines, Tier 2 3 4 (Tier 4 is cleaner than Tier 2.) Tier 4 diesel engine standards are being phased in from 2011 through 2014 by manufacturers of new engines. A Tier 2 diesel engine powers an electric motor to drill this well. www.epa.gov/nonroad-diesel/regulations.htm
Natural Gas Power Natural gas powered engines are typically cleaner than diesel engines and are the approximate equivalent of Tier 4 diesel engines. Natural gas fueled engines power electric motors to drill this well.
Venting • Releases methane, a greenhouse gas (GHG) that has • 25 times more global warming potential than CO2 • Intergovernmental Panel on Climate Change • http://ipcc-wg1.ucar.edu/wg1/Report/AR4WG1_Print_Ch02.pdf page 212 • Emits Volatile Organic Compounds (VOCs) which • contribute to ozone formation • Emits Hazardous Air Pollutants • (HAPs) such as Benzene, • Toluene, and Xylene in larger • quantities than flaring • Wastes valuable natural gas • resources
Flaring • Reduces Methane GHG emissions, however… • Combustion emissions include NOx, CO, VOCs, and • PM2.5,which can pose visibility and health problems, • and CO2(a less potent GHG). NOx and VOCs • contribute to ozone formation. • Wastes valuable natural gas resources Flaring natural gas is usually a better alternative than venting gas; however, potential fire hazards, impacts to visibility, and citizen concerns may preclude the use of flaring at certain sites. More Information at www.epa.gov/gasstar/documents/installflares.pdf
Well Completions – Reduced Emissions Completions A Best Management Practice Using “Green Completions”where there is an existing sales line to recapture a significant portion of product that would have been vented or flared. • Benefits – • Reduces Methane & VOC emissions • Recovers product for sale More information at www.epa.gov/gasstar/documents/greencompletions.pdf
Solar Power Using chemical pumps and well monitoring telemetry powered by solar panels. Benefits – Reduces truck trips, engine emissions, and methane emissions from gas pneumatic pumps. More information at www.epa.gov/gasstar/documents/workshops/2008-tech-transfer/midland6.ppt#288,1,Solar Power Applications for Methane Emission Mitigation
Electrical Power Using electricity from the nation’s power grid is typically cleaner than using onsite diesel or natural gas engines to power drill rigs, compressors, and pumping units. However, overhead power lines may have wildlife or visual impacts. • Electric Drive • Pump
Fugitive (Leaking) Emissions • Releases methane, a greenhouse gas (GHG) that has • 25 times more global warming potential than CO2 • Can emit Volatile Organic Compounds (VOCs) which • contribute to ozone formation • Can emit Hazardous Air Pollutants (HAPs) such as • Benzene, Toluene, and Xylene • Wastes valuable natural gas resources
Capturing VOCs Using enclosed tanks instead of open pits to reduce fugitive VOC emissions.
Vapor Recovery Units Using vapor recovery units on oil, condensate, and produced water storage tanks reduces fugitive VOCs and recovers BTU-rich vapors for sale or use on site. More information at www.epa.gov/gasstar/documents/ll_final_vap.pdf
Vapor Recovery Economics • Vapor recovery can capture up to 95% of hydrocarbon vapors from tanks • Recovered vapors are more valuable than natural gas and have multiple uses. The table below illustrates several possible scenarios of peak capacity for VRU sizing 29 Source: Natural Gas STAR Program/ IOGCC Workshop, Charleston, West Virginia, “Installing Vapor Recovery Units”, February 2009
Hatches, Seals, and Valves Using and maintaining proper hatches, seals, and valves to minimize VOC emissions. Thief Hatches and Vent sealing valves
Optimize Glycol Circulation and Install Flash Tank Separator (FTS) Methane emissions that result from glycol over-circulation in glycol dehydrators can be reduced by optimizing the circulation rate. Methane that flashes from rich glycol in an energy exchange pump can be captured and recycled using an FTS. More information at www.epa.gov/gasstar/documents/ll_flashtanks3.pdf
Economics of Installing FTS and Optimizing Glycol Circulation • FTS recovers about 90% of methane emissions • FTS reduces VOCs by 10 to 90% Two Options for Minimizing Glycol Dehydrator Emissions 1 – Gas price of $7/Mcf 32 Source: Natural Gas STAR Program/ IOGCC Workshop, Charleston, West Virginia, “Natural Gas Dehydration”, February 2009
NOx,SOx, CO, and CO2Controls for Compressor Engines Using…. • Closed Loop Engine Control • Controlled Engines • Selective Catalytic Reduction • System-Installed Power Supply (solar powered, battery powered) • Ultra-Low Sulfur Diesel
Selective Catalytic Reduction Selective Catalytic Reduction works by injecting Diesel Exhaust Fluid (DEF) (water & urea) into exhaust. The DEF works with the heat of the exhaust and a catalytic converter to convert the NOx into nitrogen and water vapor.
Replacement of Wet Seals with Dry Seals in Centrifugal Compressors Centrifugal wet seal compressor emissions from the seal oil degassing vent can be reduced by the replacement of wet seals with dry seals that emit less methane and have lower power requirements. More information can be found at www.epa.gov/gasstar/documents/ll_wetseals.pdf
Economics of Wet Seal Replacement Economics for 6 inch shaft beam compressor 36 Source: Natural Gas STAR Program Workshop, Gillette and Rock Springs, Wyoming, “Methane Savings from Compressors”, May 2006
Reduce Emissions from Compressor Rod Packing Systems Reciprocating compressor rod packing leaks some gas by design. Emissions from rod packing can be reduced by the economic replacement of rod packing at frequent intervals as… • Newly installed packing may leak 60 cubic feet/hr1 • Worn packing has been reported to leak up to 900 cubic feet/hour1 More Information at www.epa.gov/gasstar/documents/ll_rodpack.pdf 1 EPA Lessons Learned Reducing Methane Emissions from Compressor Rod Packing Systems, 2004.
Leak Reduction Leak Reduction Expected Payback Expected Payback (year) (year) (cf/hour) (cf/hour) 217 1 32 1 2 17 2 114 3 12 3 79 9 4 62 4 Economics of Rod Packing Replacement Replace packing when expected leak reduction will pay back cost • “leak reduction expected” is the difference between current leak rate and leak rate with new rings Rings Only Rings: $1,620 Rod: $0 Gas: $7/Mcf Operating: 8,000 hours/year Rod and Rings Rings: $1,620 Rod: $9,450 Gas: $7/Mcf Operating: 8,000 hours/year Based on 10% interest rate Mcf = thousand cubic feet 38 Source: Natural Gas STAR Program Technology Transfer Workshop, Midland, Texas, “Reciprocating Compressor Rod Packing”, February 2009
Pneumatic Devices for Emissions Control For Methane and VOC Reduction: Replace high-bleed devices with low-bleed Retrofit bleed reduction kits on high-bleed devices As part of normal operations, pneumatic devices release natural gas into the atmosphere (liquid level controllers, pressure regulators, and valve controllers) Low Bleed Pneumatic Controller More information at www.epa.gov/gasstar/documents/ll_pneumatics.pdf
Installing Plunger Lift Systems and Automated Systems in Gas Wells Methane emissions from well blowdowns can be reduced by installing plunger lifts and smart automation systems which monitor well production parameters. Source: Etopsi More info at www.epa.gov/gasstar/documents/ll_plungerlift.pdf www.epa.gov/gasstar/documents/smart_automation.pdf
EPA Natural Gas STAR Partner Experience – BP Example • Pilot installations and testing in 2000 • Installed plunger lifts with automated control systems on ~2,200 wells • ~US$15,000 per well Remote Terminal Unit (RTU) installment cost • US$50,000 -US$750,000 host system installment cost • Achieved roughly 50% reduction in venting from 2000 to 2004 • In mid 2006, “smarter” automation was applied to wells • 1,412 Mcf reported annual savings per well • Total of US$6,2 million/year savings • Emissions reduced from 4.0+ bcf/yr down to less than 0.8 bcf/yr Source: BP Natural Gas STAR Workshop 2006, “Plunger Well Vent Reduction Project”, www.epa.gov/gasstar/documents/desaulniers.pdf 41
Directed Inspection &Maintenance and Infrared Leak Detection (DI&M) Fugitive gas leaks can be reduced by implementing a DI&M Program which identifies and cost effectively fixes fugitive gas leaks using • Leak Detection • Infrared Camera • Organic Vapor Analyzer • Soap Solution • Ultrasonic Leak Detectors • Measurement • Calibrated Bagging • Rotameters • High Volume Sampler More information can be found at www.epa.gov/gasstar/documents/03_dim_in_gas_production_facilities.pdf
EPA Natural Gas STAR Partner Experience – Chevron Corp. • Scanned gas facility using GasfindIRTM Camera • 112 total leaks recorded (60 from gas plants) • Quantified leaks using Hi-Flow Sampler® • Estimated leak volume: 100,000 Mcf/yr • Estimated annual revenue lost due to natural gas, propane and condensate losses: $2.1 million Source: Natural Gas STAR Workshop, Midland, Texas 2008, “Chevron Experience: Methane Emission Mitigation”, www.epa.gov/gasstar/documents/workshops/2008-tech-transfer/midland2.ppt#288,9,DI&M Demonstration Study - IR Camera 44
Air Quality Monitoring Using Monitoring for… • Monitoring current and modeling future air quality conditions. • Designing emission control strategies. • Reviewing monitoring data and adapting to findings: • Adjusting development rates, timing, and places of development. • Refining mitigation measures (BMPs).
Part 5For More Information & BMPs EPA Natural Gas STAR Program http://www.epa.gov/gasstar/tools/recommended.html California Air Resources Board’s Clearinghouse http://www.arb.ca.gov/cc/non-co2-clearinghouse/non-co2-clearinghouse.htm Four Corners Air Quality Group http://www.nmenv.state.nm.us/aqb/4C/