Download
1 / 22
220 likes | 368 Views
The Confining Effect of End Roughness on Unconfined Compressive Strength. Zig Szczepanik Doug Milne Chis Hawkes Dept. of Civil and Geological Engineering. Background to Current Research.

E N D
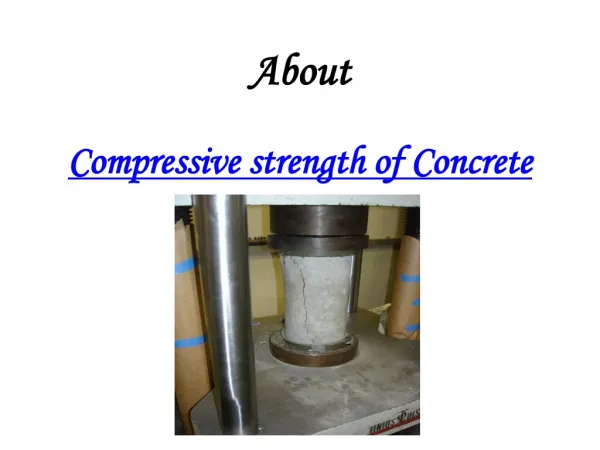
The Confining Effect of End Roughness on Unconfined Compressive Strength Zig Szczepanik Doug Milne Chis Hawkes Dept. of Civil and Geological Engineering
Background to Current Research • Long term loading tests on hard rock were conducted to determine if failure significantly below the rock UCS could be achieved (Szczepanik et. al., 2003) • Sample end conditions were varied on small samples of hard granite. A significant variation in rock strength was measured (Szczepanik et. al., 2005) • This paper presents additional results on 2 sample sizes and 2 types of granite under various sample end conditions.
SampleInformation • 28 samples – • eleven 61mm diameter • seventeen 35mm diameter • All length to diameter ratios were between 2.0 to 2.5 • Medium grained grey granite - northern Manitoba • 4 samples - Group 1 P-wave velocity (3161 to 4373 m/s) • 24 samples - Group 2 P-wave velocity (4496 to 5134 m/s) • There was no major difference between the two groups of samples
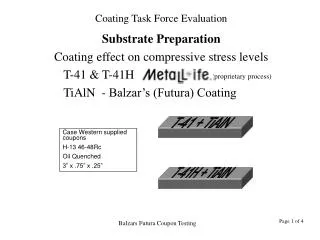
Sample End Preparation • Sample preparations were within ASTM standards • Rough Sample End Conditions • Multiple passes of a 1.5cm wide grinding wheel provided sample roughness with an asperity amplitude less than the ASTM recommended 25 x 10μm • Standard Sample End Conditions • Single pass with a grinding wheel • Smooth Sample End • Obtained by polishing standard sample ends with a thin section polishing wheel
Platen End Conditions • Three platen end conditions were used in the testing: • Polished platens were finished on a thin section polishing wheel • Smooth-striated platens were prepared on a fine grinding wheel • Grooved platens were prepared with concentric rings with an amplitude in excess of ASTM standards. • 9 samples were tested with lead foil between the sample and loading platen
Platen End Conditions • Smooth platens were prepared on a fine grinding wheel. It was initially hoped these platens would be the standard for reduced end effect. Shallow sharp grooves or striations produced high apparent friction
Platen End Conditions • Concentric grooved platens were prepared. It was initially hoped these platens would show high apparent friction, however the rounded grooves acted like bearings and produced low apparent friction
Profile length j b o i m p a c g n f e h d l k Centreline Roughness average (Ra) + + + K + y y y y = a b c n Ra n Average roughness, Ra (after Hebert, 2004)
Roughness measurements Pass length = 12.5 mm Diameter = 35.1 mm
Strain Measurements • All samples were strain gauged with circumferential gauges at the sample mid-point and 1cm from each sample end • The 35mm diameter samples were gauged with 14 or 90mm long gauges and the 61mm diameter samples were gauged with two 60 mm long strain gauges at each location • The ratio of mid strain to end strain, at 50% of the sample UCS, was a measure of sample end friction
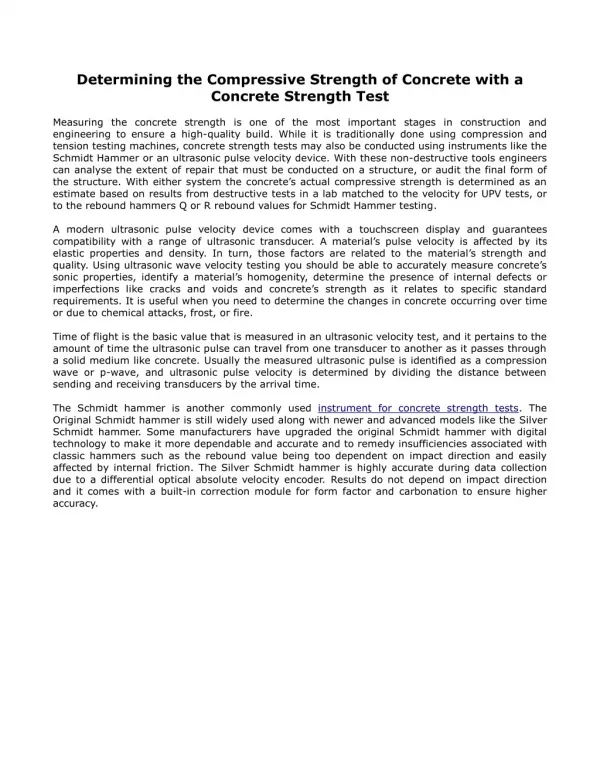
Conclusions • Unconfined compressive strength (UCS) tests are conducted with a significant degree of confinement at the sample ends. • This confinement is a function of the friction induced between the sample ends and the loading platens during testing. • This confinement significantly increased measured sample UCS values
Conclusions • Brazilian tests indicated a consistent tensile strength of 12 MPa – The minimum UCS strengths obtained were 8 times the tensile strength. • Testing is ongoing • Triaxial tests with polished ends will be done to determine a comparable confinement to standard UCS testing procedures • Other rock types will be tested • Comments are welcomed