Vehicle Flow
390 likes | 526 Views
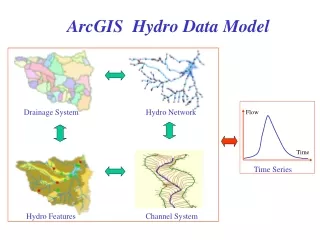
Vehicle Flow. Homework. Ch 5 # 1, 2, 4, 7, 9. Vehicle Flow. How do vehicles operate in the system capacity speed headway density. Time Space Diagrams. Show vehicle location vs. Time one way or two way any type of transportation system used to find siding placement progression

Vehicle Flow
E N D
Presentation Transcript
Homework • Ch 5 # 1, 2, 4, 7, 9
Vehicle Flow • How do vehicles operate in the system • capacity • speed • headway • density
Time Space Diagrams • Show vehicle location vs. Time • one way or two way • any type of transportation system • used to find • siding placement • progression • minimum headways • Throughput
Vehicle Following • Spacing needed for stopping
Deceleration • 3 types of deceleration • Normal dn = 8fps^2 • Emergency de = 24fps^2 • Instantaneous • Initial spacing • S = vd +v^2/2df –v^2/2dl +NL +x0 • Safest spacing when lead vehicle decelerates instantaneously and following vehicle brakes at normal deceleration
Example • What is the safe initial spacing between two vehicles traveling 40 mph if the lead vehicle uses an emergency deceleration of 24 fps^2 and the following vehicle normally decelerates at 8 fps^2? PR time = 1.5 sec, vehicle length = 20 feet, x0 = 4 feet
Flow Concepts • 4 variables • volume • speed • density • headway
Volume • # of vehicles passing a given point in a given unit time • q = n/T • cars per hour • does not tell you anything about speed or density
Speed • 2 types • Space Mean Speed • distance divided by time • useful in determining vehicle flow characteristics • Time Mean Speed • Spot speeds • Radar gun • not useful except for tickets
Example • Si = 2 miles, i = 1 - 4 • v1 = 42 mph, v2 = 39 mph, v3 = 47 mph, v4 = 50 mph • Average V = 44.5 mph • m1 = 3.1 min, m2 = 2.8 min, m3 = 3.3 min, m4 = 3.0 min • Average = 39.5 mph • What is the difference, is it significant?
Density • Concentration • vehicles per unit length • cars/mile
Headway • Time or distance between two vehicles • h = 1/q gives the time headway • h = 1/k gives distance headway • which is more useful?
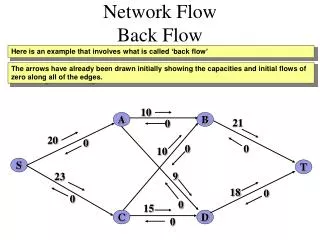
Relationships • q=uk • basic relationship • Important points • jam density • jam speed • max volume
Relationships • Shape of curves • what do they tell us?
Example • The u-k relationship is • u + 2.6 = 0.001(k – 240)^2 • Find umax, jam density, and max capacity
Shock waves • Happens when traffic is forced to change speed either slowing down or speeding up • shockwave • Can move either forward or backward • usw = (qb – qa)/(kb – ka) • a, b are 2 points of interest • If shockwave is + => heading in direction of flow • If shockwave is 0 => stationary • If shockwave is - => moving against flow
Example • A line of traffic, moving at 30 mph and a concentration of 50 veh/mi is stopped for 30 sec at a red light. Calculate the velocity and direction of the stopping wave, the length of the line of cars stopped during the 30 sec of red, and the number of cars stopped during the 30 sec of red. Assume a jam capacity of 250 veh/mi
Control of Vehicle Flows • Control vehicles • minimize accidents • maximize effectiveness • transit • airports • roadways • Channelization most common control
Control of Vehicle Flows • Speed limits • Control on Links • signage • lane width • number of lanes • headway rules
Headway Rules • RR - uses block system
Headway Rules • Aircraft • Airports • 1 aircraft on runway at any time • separation distances • 2.5 miles between aircraft • 10 miles horizontal / 2000 ft vertical in air • Control based on aircraft location • Ground control for aircraft not on runway
Capacity • Capacity based on mode • # of vehicles per hour • # of passengers per hour • arrivals, departures per hour
Highways • Capacity varies by road type • Freeways • no controls, • Intersections • traffic control • 2 lane & 4 lane roads • lead vehicle • All use Level of Service
Determining Capacity • Based on Roadway geometrics and traffic conditions • For Freeways • can determine ideal conditions and from that a maximum capacity
Peak Hour Factor • Measures demand peaking
Level of Service • LOS can be based on • delay per vehicle • speed • service flow • 6 LOS A - F • A is best • F is worst
Freeway Capacity • LOS based on • density • speed • v/c • For an LOS can find Maximum Service Flow (MSF)
MSF • MSF = qmax*(v/c) - ideal conditions • SF = q = qmax*N*fw*FHV • Table 4.3.3 for heavy vehicle factors • Table 4.3.2 for width factors
Capacity Restrictions • Non recurring • Recurring
Example • Ch 4 # 14
Pedestrians • LOS based on • speed • flow rate • v/c ratio
Bike LOS • Based on amount of hindrance
Airports • Capacity depends on landside and airside • LOS is based on delay and total time • Why are airports becoming shopping malls?
Rail • Mass transit • LOS based on pass/seat, space/ pass, • both peak and off peak • AMTRAK • LOS based on wait time, comfort, pass/seat