Effects of CP on Renal Biomarkers and HDACs
140 likes | 169 Views
Study examines impact of CP on renal markers creatinine (Cr) and blood urea nitrogen (BUN) levels in animal and cell models. CP influences Bcl-2, Bax, KIM-1 expressions and HDACs. Experimental treatments and controls are detailed with statistical significance.

Effects of CP on Renal Biomarkers and HDACs
E N D
Presentation Transcript
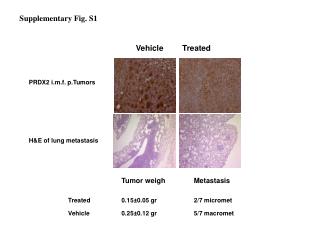
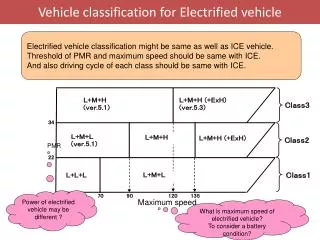
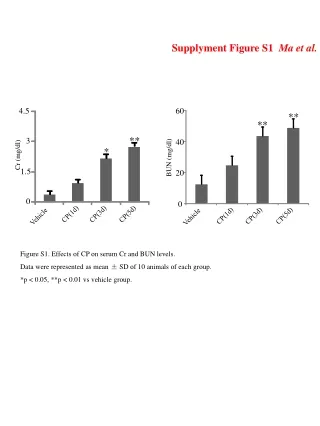
Supplyment Figure S1 Ma et al. 4.5 Cr (mg/dl) ** 3 * 1.5 0 ** BUN (mg/dl) ** Vehicle CP(1d) CP(3d) CP(5d) 60 40 20 Figure S1. Effects of CP on serum Cr and BUN levels. Data were represented as mean ± SD of 10 animals of each group. *p < 0.05, **p < 0.01 vs vehicle group. Vehicle CP(1d) CP(3d) CP(5d) 0
0.6 1.2 Supplyment Figure S2 Ma et al. 0.4 0.8 0.2 Relative protein expression 0.4 ** 0 0 KIM-1 β-actin KIM-1 β-actin - - - + + + CP(5μM) Relative protein expression HK-2 mTEC ** Figure S2. Effects of CP on expressions of KIM-1 induced by CP in HK-2 cells and mTEC cells. Data were represented as mean ± SD of three independent experiments. **p < 0.01 vs. control group. - - - + + + CP(5μM)
HK-2 Relative protein expression Relative protein expression Supplyment Figure S3 Ma et al. mTEC Bcl-2 Bax Bcl-2 Bax β-actin Bcl-2 Bax β-actin ** ** - - - + + + - - - + + + ** CP(5μM) ** CP(5μM) 1.2 Bcl-2 Bax 0.8 1.2 0.4 0.8 0 Figure S3. Effects of CP on expressions of Bcl-2 and Bax induced by CP in HK-2 cells and mTEC cells. Data were represented as mean ± SD of three independent experiments. **p < 0.01 vs. control group. 0.4 0
Supplyment Figure S4 Ma et al. 1.2 1.2 Relative protein expression Relative protein expression 0.8 0.8 HK-2 mTEC Bcl-2 Bcl-2 ** ** Bax Bax 0.4 0.4 ## ## ## ## ## ## ## 0 ## ** ** 0 Figure S4. Effects of TSA or VPA on expressions of Bcl-2 and Bax induced by CP in HK-2 cells and mTEC cells. Data were represented as mean ± SD of three independent experiments. **p < 0.01 vs control group; ##p < 0.01 vs CP-induced group. Bcl-2 Bax β-actin Bcl-2 Bax β-actin CP(5μM) TSA(100nM) VPA(1mM) CP(5μM) TSA(100nM) VPA(1mM) + - + + - + + + - + + - - - - - - - + - - + - -
Supplyment Figure S5 Ma et al. 6 4 2 0 ** Control Cisplatin ** ** HK-2 Gene expression (fold over control ) ** * HDAC6 HDAC8 HDAC7 HDAC1 HDAC5 HDAC9 HDAC4 HDAC2 HDAC3 HDAC11 HDAC10 8 6 4 2 0 Control Cisplatin ** mTEC ** Gene expression (fold over control ) * * HDAC6 HDAC7 HDAC8 HDAC1 HDAC5 HDAC9 HDAC4 HDAC2 HDAC3 HDAC11 HDAC10 Figure S5. Cisplatin differentially regulates histone deacetylase (HDAC) expression in HK-2 and mTEC cells. Expression level of different isoforms of HDAC after cisplatin administration. Data were represented as mean ± SD of three independent experiments. *p < 0.05, **p < 0.01 vs. control group.
Supplyment Figure S6 Ma et al. 1.2 0.8 1.2 mTEC HK-2 Relative protein expression Relative protein expression ** ** 0.8 0.4 0.4 0 HDAC2 β-actin 0 HDAC2 β-actin + - + - pEGFP-C1 pEGFP-C1/HDAC2 + - pEGFP-C1 pEGFP-C1/HDAC2 + - Figure S6. Effects of pEGFP-C1-HDAC2 on the expression of HDAC2 in HK-2 and mTEC cells. Data were represented as mean ± SD of three independent experiments. ** p<0.01 vs pEGFP-C1
Supplyment Figure S7 Ma et al. HK-2 CP(5μM) TSA(100nM) VPA(1mM) pEGFP-C1 pEGFP-C1/HDAC2 + - - - - - - - - - +- - + - +- - - + CP(5μM) TSA(100nM) VPA(1mM) pEGFP-C1 pEGFP-C1/HDAC2 + + - - + ++ - + - + - + + - + - + - +
Supplyment Figure S7 Ma et al. mTEC CP(5μM) TSA(100nM) VPA(1mM) pEGFP-C1 pEGFP-C1/HDAC2 + - - - - - - - - - +- - + - +- - - + CP(5μM) TSA(100nM) VPA(1mM) pEGFP-C1 pEGFP-C1/HDAC2 + + - - + ++ - + - + - + + - + - + - + Figure S7. Effects of Overexpression of HDAC2 on apoptosis by flow cytometric analysis in CP-treated HK-2 cells and mTEC cells.
Supplyment Figure S8 Ma et al. 1.5 mTEC HK-2 Bax Bcl-2 Relative protein expression Bax Bcl-2 && 1 Relative protein expression 1.5 $$ ** ** ** && ** ** ** $$ 1 0.5 0.5 ** ** ** ** 0 ** ** 0 Bcl-2 Bax β-actin Bcl-2 Bax β-actin CP(5μM) TSA(100nM) VPA(1mM) pEGFP-C1 pEGFP-C1/HDAC2 - - - - - +- - + - +- - - + ++ - + - + - + + - + - + - + + - - - - - - - - - +- - + - +- - - + ++ - + - + - + + - + - + - + + + - - + + - - - - + + - - + Figure S8. Effects of Overexpression of HDAC2 on expressions of Bcl-2 and Bax induced by CP in HK-2 cells and mTEC cells. Data were represented as mean ± SD of three independent experiments. ** p<0.01 vs control group; &p< 0.01, &&p< 0.01 vs pEGFP-C1-alone+TSA; $$p<0.01 vs pEGFP-C1-alone+VPA
Supplyment Figure S9 Ma et al. Figure S9. Effects of HDAC inhibitor on expressions of KIM-1, Bcl-2 and Bax. Data were represented as mean ± SD of three independent experiments. **p < 0.01 vs. control group. ##p < 0.01 vs. CP-induced group. Relative protein expression HK-2 Relative protein expression mTEC 1 0.5 ## ## ## ## ** ** 0 1 BMP-7 β-actin BMP-7 β-actin CP(5μM) TSA(100nM) VPA(1mM) + - - + - + - - - + + - CP(5μM) TSA(100nM) VPA(1mM) + - - + - + - - - + + - 0.5 0
1.5 1.2 1 0.8 mTEC 0.5 HK-2 Relative protein expression Relative protein expression && ** ** 0.4 && Supplyment Figure S10 Ma et al. 0 0 HDAC2 β-actin HDAC2 β-actin CP(5μM) NC siHDAC2 CP(5μM) NC siHDAC2 + + - + - + - - - + - - + - + - - - + - - + + - Figure S10. Expression of HDAC2 was suppressed in HK-2 and mTEC cells with knockdown HDAC2 Data were represented as mean ± SD of three independent experiments. **p < 0.01 vs. control group. &&p < 0.01 vs.NC
Supplyment Figure S11 Ma et al. 1.2 0.8 0.4 1.5 0 1 HK-2 mTEC Relative protein expression && ** Relative protein expression ** && 0.5 0 Figure S11. Expression of BMP-7 was promoted in HK-2 and mTEC cells with knockdown HDAC2 Data were represented as mean ± SD of three independent experiments. **p < 0.01 vs. control group. &&p < 0.01 vs.NC BMP-7 β-actin BMP-7 β-actin CP(5μM) NC siHDAC2 + + - + - + - - - + - - CP(5μM) NC siHDAC2 + + - + - + - - - + - -
HK-2 Supplyment Figure S12 Ma et al. Figure S12. Effects of BMP-7 on Bcl-2, Bax and KIM-1 with recombinant BMP-7 addition in HK-2 and mTEC cells Data were represented as mean ± SD of three independent experiments. . **p < 0.01 vs. control group. #p < 0.01, ##p < 0.01 vs. CP-induced group.
Supplyment Figure S13 Ma et al. 1.5 Figure S13. Expression of BMP-7 was suppressed in HK-2 cells with knockdown BMP-7 Data were represented as mean ± SD of three independent experiments. **p < 0.01 vs. NC Relative protein expression HK-2 1 0.5 ** 0 BMP-7 β-actin NC siBMP-7