Infrared Absorption and Mass Spectrometry
Learn about frequency absorption in 1,3-butadiene, IR absorption intensity, dipole moments in IR, and mass spectrometry. Explore chemical structures, vibrational modes, and spectroscopic techniques. Get insights on functional group absorptions and interpreting IR spectra.

Infrared Absorption and Mass Spectrometry
E N D
Presentation Transcript
Absorption spectrum for 1,3-butadiene CH2=CH-CH=CH2
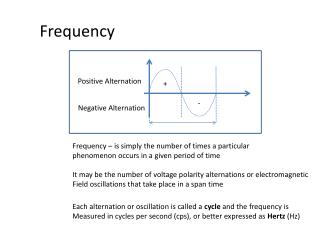
IR Absorption Intensity • Overall peak intensity is related to the concentration of the sample • Relative peak intensity is additive: A large number of similar groups (e.g., alkyl) will increase the intensity of a given peak • Relative peak intensity is also due to the dipole moment
Dipole Moments in IR • Recall: Dipole moment is related to the charge separation and distance between two atoms • As the bond stretches, the dipole increases • As the bond compresses, the dipole decreases • With a match in frequency the bond dipole gains energy as the light wave loses energy 12.3 Infrared Absorption and Chemical Structure
Dipole Moments in IR • The electric field of a light wave cannot interact with a bond that has no dipole • Bonds with no dipole will not absorb in IR • Conversely, groups with large dipoles (e.g., C=O, O-H) provide intense absorptions 12.3 Infrared Absorption and Chemical Structure
Dipole Moments in IR • Molecular vibrations that occur but do not give rise to IR absorption are said to be infrared-inactive • Any vibration that does give rise to an absorption is said to be infrared-active 12.3 Infrared Absorption and Chemical Structure
IR Spectra of Alkanes • C-H stretching: 2850-2960 cm-1 • C-H bending: fingerprint 12.4 Functional-Group Infrared Absorptions
IR Spectra of Alkyl Halides • Normally at the low-wavenumber end • Commonly obscured by other peaks • C-F stretch: 1000-1100 cm-1 • MS and NMR are more useful for identifying alkyl halides 12.4 Functional-Group Infrared Absorptions
IR Spectra of Alkenes 12.4 Functional-Group Infrared Absorptions
IR Spectra of Alkenes 12.4 Functional-Group Infrared Absorptions
IR Spectra of Alkenes 12.4 Functional-Group Infrared Absorptions
IR Spectra of Alkenes 12.4 Functional-Group Infrared Absorptions
IR Spectra of Alcohols and Ethers • O-H stretch (H-bonded): 3200-3400 cm-1 • O-H stretch (not H-bonded): 3600 cm-1 • C-O stretch: 1050-1200 cm-1 (ROH and ethers) 12.4 Functional-Group Infrared Absorptions
Problems • The IR spectrum of phenylacetylene is shown below. Which absorption bands can you identify?
Which of the following compounds most likely corresponds to the IR spectrum below?
The Infrared Spectrometer • Most modern IR spectrometers are Fourier-transform spectrometers • Liquid samples can be analyzed undiluted (neat), as a mineral oil dispersion (mull), or as a solution (CHCl3 or CH2Cl2 as solvent) • Solid samples can be analyzed as a fused KBr pellet 12.5 Obtaining an Infrared Spectrum
Mass Spectrometry • Spectroscopic technique used for: • Determination of molecular mass • Determination of partial or whole molecular structure • Confirmation of suspected molecular structure • The instrument used is a mass spectrometer
Electron-Impact Mass Spectra • The sample is vaporized in a vacuum and subjected to an electron beam of high energy • The energy of the beam is typically ~70 eV (6700 kJ/mol) • This easily exceeds that of chemical bonds • A radical-cation is produced 12.6 Introduction to Mass Spectrometry
Fragmentation Reactions 12.6 Introduction to Mass Spectrometry
Each of the fragments are separated according to their mass-to-charge ratio (m/z) • Only ions appear in the mass spectrum • neutral molecules and radicals do not appear
The Mass Spectrum of Methane • Molecular ion (M): The ion derived from electron ejection only (no fragmentation) • Base peak: The ion of greatest relative abundance in the spectrum • M and base peak are commonly different