Download
1 / 47
470 likes | 575 Views
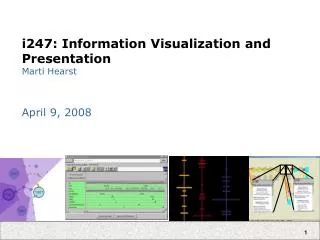
Discover how increased computing power impacts data visualization with high-res meshes, large data ensembles, and a multitude of variables. Learn about the evolution from Terascale to Exascale Visualization, and explore the challenges and opportunities of the data movement landscape. Join us in preparing for a whole new world of visualization possibilities.

E N D
EXASCALE VISUALIZATION:GET READY FOR A WHOLE NEW WORLD Hank Childs, Lawrence Berkeley Lab & UC Davis July 1, 2011
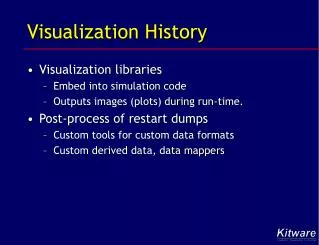
How does increased computing power affect the data to be visualized? High-res meshes Large # of variables / more physics Large ensembles Your mileage may vary; some simulations produce a lot of data and some don’t. Large # of time steps Thanks!: Sean Ahern & Ken Joy
Some history behind this presentation… • “Architectural Problems and Solutions for Petascale Visualization and Analysis”
Some history behind this presentation… • “Why Petascale Visualization Will Changes The Rules” NSF Workshop on Petascale I/O
Some history behind this presentation… • “Why Petascale Visualization Will Changes The Rules” • “Exascale Visualization: Get Ready For a Whole New World” NSF Workshop on Petascale I/O
Fable: The Boy Who Cried Wolf • Once there was a shepherd boy who had to look after a flock of sheep. One day, he felt bored and decided to play a trick on the villagers. He shouted, “Help! Wolf! Wolf!” The villagers heard his cries and rushed out of the village to help the shepherd boy. When they reached him, they asked, “Where is the wolf?” The shepherd boy laughed loudly, “Ha, Ha, Ha! I fooled all of you. I was only playing a trick on you.”
Fable: The Boy Who Cried Wolf • Once there was a viz expert who had to look after customers. One day, he felt bored and decided to play a trick on the villagers. He shouted, “Help! Wolf! Wolf!” The villagers heard his cries and rushed out of the village to help the shepherd boy. When they reached him, they asked, “Where is the wolf?” The shepherd boy laughed loudly, “Ha, Ha, Ha! I fooled all of you. I was only playing a trick on you.”
Fable: The Boy Who Cried Wolf • Once there was a viz expert who had to look after customers. One day, he needed funding and decided to play a trick on his funders. He shouted, “Help! Wolf! Wolf!” The villagers heard his cries and rushed out of the village to help the shepherd boy. When they reached him, they asked, “Where is the wolf?” The shepherd boy laughed loudly, “Ha, Ha, Ha! I fooled all of you. I was only playing a trick on you.”
Fable: The Boy Who Cried Wolf • Once there was a viz expert who had to look after customers. One day, he needed funding and decided to play a trick on his funders. He shouted, “Help! Big Big Data!” The villagers heard his cries and rushed out of the village to help the shepherd boy. When they reached him, they asked, “Where is the wolf?” The shepherd boy laughed loudly, “Ha, Ha, Ha! I fooled all of you. I was only playing a trick on you.”
Fable: The Boy Who Cried Wolf • Once there was a viz expert who had to look after customers. One day, he needed funding and decided to play a trick on his funders. He shouted, “Help! Big Big Data!” The funders heard his cries and sent lots of money to help the viz expert. When they reached him, they asked, “Where is the wolf?” The shepherd boy laughed loudly, “Ha, Ha, Ha! I fooled all of you. I was only playing a trick on you.”
Fable: The Boy Who Cried Wolf • Once there was a viz expert who had to look after customers. One day, he needed funding and decided to play a trick on his funders. He shouted, “Help! Big Big Data!” The funders heard his cries and sent lots of money to help the viz expert. When petascale arrived, they asked, “Where is the problem?” The shepherd boy laughed loudly, “Ha, Ha, Ha! I fooled all of you. I was only playing a trick on you.”
Fable: The Boy Who Cried Wolf • Once there was a viz expert who had to look after customers. One day, he needed funding and decided to play a trick on his funders. He shouted, “Help! Big Big Data!” The funders heard his cries and sent lots of money to help the viz expert. When petascale arrived, they asked, “Where is the problem?” The viz expert shrugged and said, “The problem isn’t quite here yet, but it will be soon.” This is NOT the story of this presentation.
The message from this presentation… I/O Bandwidth I/O Bandwidth Data Movement Data Movement’s 4 Angry Pups Exascale Visualization TerascaleVisualization Petascale Visualization
Outline • The Terascale Strategy • The I/O Wolf & Petascale Visualization • An Overview of the Exascale Machine • The Data Movement Wolf and Its 4 Angry Pups • Under-represented topics • Conclusions
Outline • The Terascale Strategy • The I/O Wolf & Petascale Visualization • An Overview of the Exascale Machine • The Data Movement Wolf and Its 4 Angry Pups • Under-represented topics • Conclusions
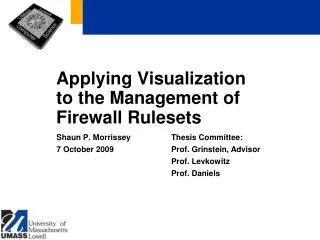
P2 P4 P1 P3 P0 P5 P8 P7 P6 P9 Production visualization tools use “pure parallelism” to process data. Parallelized visualization data flow network Parallel Simulation Code Read Process Render Processor 0 Read Process Render P0 P1 P2 P3 Processor 1 P4 P5 P6 P7 Read Process Render Pieces of data (on disk) P8 P9 Processor 2
Pure parallelism • Pure parallelism is data-level parallelism, but… • Other data-level techniques exist that optimize processing of data, for example reducing the data considered. • Pure parallelism: “brute force” … processing full resolution data using data-level parallelism • Pros: • Easy to implement • Cons: • Requires large I/O capabilities • Requires large amount of primary memory
Pure parallelism and today’s tools • Three of the most popular end user visualization tools for large data -- VisIt, ParaView, & EnSight -- primarily employ a pure parallelism + client-server strategy. • All tools working on advanced techniques as well • Of course, there’s lots more technology out there besides those three tools…
Outline • The Terascale Strategy • The I/O Wolf & Petascale Visualization • An Overview of the Exascale Machine • The Data Movement Wolf and Its 4 Angry Pups • Under-represented topics • Conclusions
“Petascale machine” Terascale machine I/O and visualization • Pure parallelism is almost always >50% I/O and sometimes 98% I/O • Amount of data to visualize is typically O(total mem) • Two big factors: • how much data you have to read • how fast you can read it • Relative I/O (ratio of total memory and I/O) is key Memory I/O FLOPs
Trends in I/O c/o David Pugmire, ORNL
Why is relative I/O getting slower? • I/O is quickly becoming a dominant cost in the overall supercomputer procurement. • And I/O doesn’t pay the bills. • Simulation codes aren’t as exposed. We need to de-emphasize I/O in our visualization and analysis techniques.
There are “smart techniques” that de-emphasize memory and I/O. • Out of core • Data subsetting • Multi-resolution • In situ
Petascale visualization will likely require a lot of solutions. Multi-res Data subsetting In situ Out-of-core All visualization and analysis work Do remaining ~5% on SC w/ pure parallelism
Outline • The Terascale Strategy • The I/O Wolf & Petascale Visualization • An Overview of the Exascale Machine • The Data Movement Wolf and Its 4 Angry Pups • Under-represented topics • Conclusions
Exascale hurdle: memory bandwidth eats up the entire power budget c/o John Shalf, LBNL
The change in memory bandwidth to compute ratio will lead to new approaches. • Example: linear solvers • They start with a rough approximation and converge through an iterative process. • 1.125 1.1251 1.125087 1.12508365 • Each iteration requires sending some numbers to neighboring processors to account for neighborhoods split over multiple nodes. • Proposed exascale technique: devote some threads of the accelerator to calculating the difference from the previous iteration and just sending the difference. • Takes advantage of “free” compute and minimizes expensive memory movement. Inspired by David Keyes, KAUST
Architectural changes will make writing fast and reading slow. • Great idea: put SSDs on the node • Great idea for the simulations … • … scary world for visualization and analysis • We have lost our biggest ally in lobbying the HPC procurement folks • We are unique as data consumers. • $200M is not enough… • The quote: “1/3 memory, 1/3 I/O, 1/3 networking … and the flops are free” • Budget stretched to its limit and won’t spend more on I/O.
Summarizing exascale visualization • Hard to get data off the machine. • And we can’t read it in if we do get it off. • Hard to even move it around the machine. • Beneficial to process the data in situ.
Outline • The Terascale Strategy • The I/O Wolf & Petascale Visualization • An Overview of the Exascale Machine • The Data Movement Wolf and Its 4 Angry Pups • Pup #1: In Situ Systems Research • Under-represented topics • Conclusions
Possible in situ visualization scenarios We don’t know what the best technique will be for this machine. And it might be situation dependent. Visualization could be a service in this system (tightly coupled)… Physics #1 Physics #1 Physics #1 Physics #1 Physics #1 Physics #1 Physics #1 Physics #1 Physics #1 Physics #2 Physics #2 Physics #2 Physics #2 Physics #2 Physics #2 Physics #2 Physics #2 Physics #2 … … … … … … … … … … Physics #n Physics #n Physics #n Physics #n Physics #n Physics #n Physics #n Physics #n Physics #n Services Services Services Services Services Services Services Services Viz Viz Viz Services Viz Viz … or visualization could be done on a separate node located nearby dedicated to visualization/analysis/IO/etc. (loosely coupled) • We will possibly need to run on: • The accelerator in a lightweight way • The accelerator in a heavyweight way • A vis cluster (?) Specialized vis & analysis resources One of many nodes dedicated to vis/analysis/IO Viz Viz Accelerator, similar to HW on rest of exascale machine (e.g. GPU) … or maybe the data is reduced and sent to dedicated resources off machine! … or maybe this is a high memory quad-core running Linux! … And likely many more configurations Viz Viz
Reducing data to results (e.g. pixels or numbers) can be hard. • Must to reduce data every step of the way. • Example: contour + normals + render • Important that you have less data in pixels than you had in cells. (*) • Could contouring and sending triangles be a better alternative? • Easier example: synthetic diagnostics Physics #1 Physics #1 Physics #1 Physics #1 Physics #2 Physics #2 Physics #2 Physics #2 … … … … Physics #n Physics #n Physics #n Physics #n Services Services Services Services One of many nodes dedicated to vis/analysis/IO Viz Viz Viz Viz
Outline • The Terascale Strategy • The I/O Wolf & Petascale Visualization • An Overview of the Exascale Machine • The Data Movement Wolf and Its 4 Angry Pups • Pup #2: Programming Languages • Under-represented topics • Conclusions
Angry Pup #2: Programming Language • VTK: enables the community to develop diverse algorithms for diverse execution models for diverse data models • Important benefit: “write once, use many” • Substantial investment • We need something like this for exascale. • Will also be a substantial investment • Must be: • Lightweight • Efficient • Able to run in a many core environment OK, what language is this in? OpenCL? DSL? … not even clear how to start
Outline • The Terascale Strategy • The I/O Wolf & Petascale Visualization • An Overview of the Exascale Machine • The Data Movement Wolf and Its 4 Angry Pups • Pup #3: Memory Footprint • Under-represented topics • Conclusions
Memory efficiency • Memory will be the 2nd most precious resource on the machine. • There won’t be a lot left over for visualization and analysis. • Zero copy in situ is an obvious start • Templates? Virtual functions? • Ensure fixed limits for memory footprints (Streaming?)
Outline • The Terascale Strategy • The I/O Wolf & Petascale Visualization • An Overview of the Exascale Machine • The Data Movement Wolf and Its 4 Angry Pups • Pup #4: In Situ-Fueled Exploration • Under-represented topics • Conclusions
Do we have our use cases covered? ? • Three primary use cases: • Exploration • Confirmation • Communication Examples: Scientific discovery Debugging Examples: Data analysis Images / movies Comparison In situ Examples: Data analysis Images / movies
Can we do exploration in situ? Having a human in the loop may prove to be too inefficient. (This is a very expensive resource to hold hostage.)
Enabling exploration via in situ processing • Requirement: must transform the data in a way that both reduces and enables meaningful exploration. • Subsetting • Exemplar subsetting approach: query-driven visualization • User applies repeated queries to better understand data • New model: produce set of subsets in situ, explore it with postprocessing • Multi-resolution • Old model: user looks at coarse data, but can dive down to original data. • New model: branches of the multi-res tree are pruned if they are very similar. (compression!) It is not clear what the best way is to use in situ processing to enable exploration with post-processing … it is only clear that we need to do it.
Outline • The Terascale Strategy • The I/O Wolf & Petascale Visualization • An Overview of the Exascale Machine • The Data Movement Wolf and Its 4 Angry Pups • Under-represented topics • Conclusions
Under-represented topics in this talk. • We will have quintillions of data points … how do we meaningfully represent that with millions of pixels? • Data is going to be different at the exascale: ensembles, multi-physics, etc. • The outputs of visualization software will be different. • Accelerators on exascale machine are likely not to have cache coherency • How well do our algorithms work in a GPU-type setting? • We have a huge investment in CPU-SW. What now? • What do we have to do to support resiliency issue? The biggest underrepresented topic is it will be even harder to understand data; we will need new techniques.
Outline • The Terascale Strategy • The I/O Wolf & Petascale Visualization • An Overview of the Exascale Machine • The Data Movement Wolf and Its 4 Angry Pups • Under-represented topics • Conclusions
Exascale Visualization Summary (1/3) • We are unusual: we are data consumers, not data producers, and the exascale machine is being designed for data producers • So the exascale machine will almost certainly lead to a paradigm shift in the way visualization programs process data. • Where to process data and what data to move will be a central issue. • There are a lot of things we don’t know how to do yet.
Exascale Visualization Summary (2/3) • In addition to the I/O “wolf”, we will now have to deal with a data movement “wolf”, plus its 4 pups: • In Situ System • Programming Language • Memory Efficiency • In Situ-Fueled Exploration
Three Strategies for Three Epochs Pure parallelism Multi-resolution In situ Out-of-core Data subsetting petascale terascale exascale