Download
1 / 36
370 likes | 403 Views
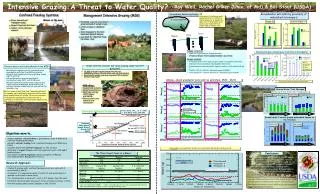
This seminar explores the patterns, sources, and fates of lake Dissolved Organic Carbon (DOC) in the Adirondack region. By implementing a mass balance model, the study investigates how upland and wetland vegetation composition influences DOC concentrations. Utilizing data from over 600 lakes, the spatially-explicit approach assesses the loading of DOC to lakes based on vegetation types and flow-path distances. The findings aim to enhance the understanding of lake ecosystems and inform future forest ecology studies.

E N D
A Mass-Balance, Watershed-Scale Analysis of Dissolved Organic Carbon (DOC) in Adirondack Lakes Seminar 5 Likelihood Methods in Forest Ecology October 9th – 20th , 2006
Collaborators Mike Pace, Michael Papaik, Roxane Maranger (IES) Ray Curran, Dan Spada, Karen Roy, Avram Primack (Adirondack Park Agency)
Patterns and Consequences of Variation in Lake DOC • Lakes within a given region can vary dramatically in dissolved organic carbon (DOC) concentrations. • DOC in 1470 lakes sampled by the Adirondack Lake Survey Corporation (ALSC) in the 1980’s ranged from 0.2 - 35 mg/L.
Patterns and Consequences of Variation in Lake DOC • Low DOC lakes typically have • high light penetration, • higher pH (unless acidified by mineral acids), and • richer oxygen conditions • Low DOC lakes are also more susceptible to • acidification, • eutrophication, and • UV-light effects
Patterns and Consequences of Variation in Lake DOC • Acid deposition has reduced DOC in many north temperature lakes, with attendant increases in UV light penetration. • High DOC lakes appear to have higher levels of contamination with mercury
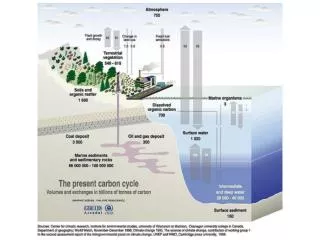
Sources and Fates of Lake DOC • The bulk of the DOC in lakes originates from decomposition in wetland and upland ecosystems within the watershed. • As it moves from uplands to lakes, DOC links terrestrial, wetland, littoral, and open water habitats. • Lakes export far less DOC than they import. Fates of DOC in lakes include photolysis, decomposition, flocculation and sedimentation.
Objectives • Most previous studies of variation in lake DOC have relied on multiple regression models. • We developed an alternative approach, based on mass balance principles, that focuses on the inputs and losses of DOC. • Our most basic objective was to understand how the composition and spatial configuration of the upland and wetland vegetation within a watershed influences DOC concentrations within each lake.
Approach • Our approach takes advantage of data sets available for the watersheds of over 600 lakes in the Adirondack Mountains of New York. • The approach is spatially-explicit, and divides each watershed into 10 x 10 m grid cells. • Our analysis estimates the loading of DOC to the lakes as a function of: • the type of vegetation in each grid cell, and • the flow-path distance from the cell to the lakeshore.
Map of the roads and boundary of the Adirondack Park. Upland vegetation types of the 610 sampled watersheds are indicated in shades of green. Sampled lakes are shown in blue.
Watershed and Lake Basin Characteristics of 355 Adirondack Headwater Lakes
A Mass Balance Model of Variation in Lake DOC • We assume that lake DOC is in approximate steady state from year-to year. Thus, inputs to a lake should approximately equal outputs. • Inputs: • Within-lake annual net production (assumed to be a linear function of lake area) • Input from wetlands and upland vegetation within the watershed • Outputs: • Lake discharge • Within-lake degradation
Inputs to Headwater Lakes for j = 1..n pixels (100 m2) of i = 1..c vegetation types, where • Dij is the flowpath distance from pixelij to the lakeshore • LakeArea is lake surface area (in m2), • p1 is the estimated within-lake DOC production (g/m2), • Li is the estimated DOC export (g/100 m2) of vegetation type i, and • i, and i are estimated parameters that determine the decline in DOC loadingof vegetation type i with distance from the lake
Lake DOC Outputs • Lake Discharge • Discharge = DOC concentration * lake volume * flushing rate • Within-Lake Degradation • Degradation = DOC concentration * lake volume * k • Also allow k to vary as a function of • ANC: k = a + b*ANC • Depth: k = a * exp(-b*depth)
Interannual Variation in Lake DOC Concentration and Watershed Loading • BACKGROUND • The lakes were sampled during a very narrow time period in late summer of one of the 4 years from 1984 – 1987 • Lakes sampled in 1986 had an average DOC concentration of ~ 8 mg/l, compared to ~ 6 mg/l for lakes sampled in the other three years. • The watershed and lake basin characteristics of the lakes sampled in a given year did not vary significantly from year to year, suggesting that the observed temporal variation was due to interannual variation in climate and/or hydrology • APPROACH • We treated 1984 as the benchmark, and then estimated how much total watershed loading would have had to vary (as a percentage of the 1984 benchmark) to account for the observed year-to-year variation in mean DOC of lakes sampled in that year
Adding Upstream Lakes – a recursive model • Include watersheds that have embedded ponds within the watershed • For sampled ponds that have other ponds immediately upstream, add inputs from the immediately upstream pond to the loading term (number of immediately upstream ponds is as high as 8, along a branching stream) • Add a term to the model to estimate the percentage of upstream inputs that actually make it to the lake
Parameters Estimated by the Analysis • 3 parameters for each vegetation type • 1 parameter for within-lake production • 1-2 parameter(s) for within-lake decay (k) • 3 parameters to account for interannual variation in total loading • = total of 41-42 parameters when using 12 cover types • Solve for the parameter values that provide the best fit to the observed variation in lake DOC (i.e. maximize the likelihood of observing the dataset) using simulated annealing (a global optimization procedure)
Box Plots of Area Weighted Mean Distance to Lake For the 12 Cover Types Area-Weighted Mean Distance (m) Cover Type
Model comparison 1 ANC model compared against basic model with just 348 lakes
Estimated Interannual Variation in Total Watershed Loading to Headwater Lakes (1984 = 100)
Upland cover types wetlands Estimated loading from different cover types (all lakes) 532.1 Error bars are 2-unit support limits
Results from Alternative Models • Significantly worse fits produced when: • assuming no decline in loading with distance for all cover types • Using a “topographic index” to identify and limit inputs to areas likely to have saturated soils • Limiting distance to specified distances from the lake • Calculating distance to nearest open water (stream or lakeshore) rather than all the way to the lakeshore
Effects of In-Lake Processes • Net In-Lake DOC Production: • basic model estimate: 12.4 kg/ha (95% S.I. = 0 – 26.9) • In-Lake Decay • basic model estimate: 0.82 (95% S.I. = 0.69 – 1.00) • declines significantly with depth • marginal increase with fraction of loading from wetlands • hint of increase with ANC
CONCLUSIONS • Loading of DOC from upland vegetation types associated with disturbance (logging, beech bark disease, and limited lakeshore development) • was very high when the disturbance was immediately adjacent to the lake, • but declined dramatically with distance from the lake • Similar patterns for wetlands dominated by dead trees (beaver ponds)
CONCLUSIONS • However, these small headwater watersheds (most with thin, glacial till soils) are very well “plumbed”. Inputs do not decline significantly with distance from the lake for the major wetland and forest types • There was significant variation in DOC loading from different vegetation types, however: • The main closed forest types (deciduous, mixed, conifer) had approximately equal predicted loading of ~ 50 kg/ha/yr, and • 4 of the most common wetland types also had approximately equal predicted loading of ~ 200 kg/ha/yr
CONCLUSIONS • Thus, as expected, wetlands generally export much more DOC per unit area than uplands • However, as a result of the much larger area of uplands (~ 90% of drainage area), upland forests are the dominant source of DOC in these lakes