Download
1 / 58
580 likes | 601 Views
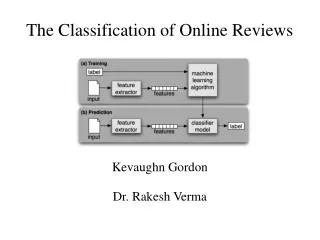
This mini review provides insights into the performance of simple linear classifiers, nearest neighbor, and decision trees in solving classification problems. Decision boundaries and decision trees are sketched to illustrate their effectiveness.

E N D
The next 6 pages are mini reviews of your ML classification skills
10 9 8 7 6 5 4 3 2 1 1 2 3 4 5 6 7 8 9 10 Look at the classification problem to the left. How well to you think a simple linear classifier would work? Draw the decision boundary for it (just a rough sketch) How well to you think a nearest neighbor would work? Draw the decision boundary for it (just a rough sketch) How well to you think a decision tree would work? Draw the decision tree (there may be more than one good one), and draw the decision boundary (just a rough sketch)
10 9 8 7 6 5 4 3 2 1 1 2 3 4 5 6 7 8 9 10 Look at the classification problem to the left. How well to you think a simple linear classifier would work? Draw the decision boundary for it (just a rough sketch) How well to you think a nearest neighbor would work? Draw the decision boundary for it (just a rough sketch) How well to you think a decision tree would work? Draw the decision tree, (there may be more than one good one), and draw the decision boundary (just a rough sketch)
Look at the classification problem to the left. How well to you think a simple linear classifier would work? Draw the decision boundary for it (just a rough sketch) How well to you think a nearest neighbor would work? Draw the decision boundary for it (just a rough sketch) How well to you think a decision tree would work? Draw the decision tree, (there may be more than one good one), and draw the decision boundary (just a rough sketch) 10 9 8 7 6 5 4 3 2 1 1 2 3 4 5 6 7 8 9 10
10 9 8 7 6 5 4 3 2 1 1 2 3 4 5 6 7 8 9 10 Look at the classification problem to the left. How well to you think a simple linear classifier would work? Draw the decision boundary for it (just a rough sketch) How well to you think a nearest neighbor would work? Draw the decision boundary for it (just a rough sketch) How well to you think a decision tree would work? Draw the decision tree, and draw the decision boundary (just a rough sketch) Note: This is a tricky one. There is a good decision tree for this problem, but it is not clear that the algorithm we discussed would find it. For now, just draw the best decision tree for this problem
10 9 8 7 6 5 4 3 2 1 1 2 3 4 5 6 7 8 9 10 • In this example we know both the x and y value for all our examples: • However, suppose that we only had the X value • How well to you think a simple linear classifier would work? Draw the decision boundary for it (just a rough sketch) • How well to you think a decision tree would work? Draw the decision tree, and draw the decision boundary (just a rough sketch) • Now suppose that we only had the Y value • How well to you think a simple linear classifier would work? Draw the decision boundary for it (just a rough sketch) • How well to you think a decision tree would work? Draw the decision tree, and draw the decision boundary (just a rough sketch) Y X
10 9 8 7 6 5 4 3 2 1 1 2 3 4 5 6 7 8 9 10 Look at the classification problem to the left. How well to you think a simple linear classifier would work? Draw the decision boundary for it (just a rough sketch) How well to you think a nearest neighbor would work? Draw the decision boundary for it (just a rough sketch) How well to you think a decision tree would work? Draw the decision tree, and draw the decision boundary (just a rough sketch) Note: This is a tricky one. There is a good decision tree for this problem, but it is not clear that the algorithm we discussed would find it. For now, just draw the best decision tree for this problem
What is Clustering? Also called unsupervised learning, sometimes called classification by statisticians and sorting by psychologists and segmentation by people in marketing • Organizing data into classes such that there is • high intra-class similarity • low inter-class similarity • Finding the class labels and the number of classes directly from the data (in contrast to classification). • More informally, finding natural groupings among objects.
Here is a clustering (segmentation) of US residents. Note that the labels placed on the clusters “tends to own trucks”, “trend to bank online” etc., were put there after the clustering was performed, to help explain the clusters, they where not inputs into the clustering algorithm. Notes: The clusters are brushed onto the map, the clusters are hierarchical, they used K-means1. • How is this information useful? • Suppose you want to know where to open a vegetarian café. • Suppose you want to find likely republican donors. • Suppose you want to send one million coupons for 10% off a new bike • Suppose you want to know the population most likely to get Zika. • etc http://www.esri.com/library/fliers/pdfs/tapestry_segmentation.pdf 1http://www.directionsmag.com/entry/an-interview-with-esri-biss-lynn-wombold-director-of-data-development/123698
This was classification This is clustering
What is Clustering? Also called unsupervised learning, sometimes called classification by statisticians and sorting by psychologists and segmentation by people in marketing • Organizing data into classes such that there is • high intra-class similarity • low inter-class similarity • Finding the class labels and the number of classes directly from the data (in contrast to classification). • More informally, finding natural groupings among objects.
What is a natural grouping among these objects? Clustering is subjective Simpson's Family Females Males School Employees
What is Similarity? The quality or state of being similar; likeness; resemblance; as, a similarity of features. Webster's Dictionary Similarity is hard to define, but… “We know it when we see it” The real meaning of similarity is a philosophical question. We will take a more pragmatic approach.
Defining Distance Measures Definition: Let O1 and O2 be two objects from the universe of possible objects. The distance (dissimilarity) between O1 and O2 is a real number denoted by D(O1,O2) Peter Piotr 0.23 3 342.7
Peter Piotr When we peek inside one of these black boxes, we see some function on two variables. These functions might very simple or very complex. In either case it is natural to ask, what properties should these functions have? d('', '') = 0 d(s, '') = d('', s) = |s| -- i.e. length of s d(s1+ch1, s2+ch2) = min( d(s1, s2) + if ch1=ch2 then 0 else 1 fi, d(s1+ch1, s2) + 1, d(s1, s2+ch2) + 1 ) 3 • What properties should a distance measure have? • D(A,B) = D(B,A) Symmetry • D(A,A) = 0 Constancy of Self-Similarity • D(A,B) = 0 IIf A= B Positivity (Separation) • D(A,B) D(A,C) + D(B,C) Triangular Inequality
Intuitions behind desirable distance measure properties D(A,B) = D(B,A)Symmetry Otherwise you could claim “Alex looks like Bob, but Bob looks nothing like Alex.” D(A,A) = 0Constancy of Self-Similarity Otherwise you could claim “Alex looks more like Bob, than Bob does.” D(A,B) = 0 IIf A=B Positivity (Separation) Otherwise there are objects in your world that are different, but you cannot tell apart. D(A,B) D(A,C) + D(B,C)Triangular Inequality Otherwise you could claim “Alex is very like Bob, and Alex is very like Carl, but Bob is very unlike Carl.”
Two Types of Clustering • Partitional algorithms: Construct various partitions and then evaluate them by some criterion (we will see an example called BIRCH) • Hierarchical algorithms: Create a hierarchical decomposition of the set of objects using some criterion Partitional Hierarchical
Desirable Properties of a Clustering Algorithm • Scalability (in terms of both time and space) • Ability to deal with different data types • Minimal requirements for domain knowledge to determine input parameters • Able to deal with noise and outliers • Insensitive to order of input records • Incorporation of user-specified constraints • Interpretability and usability
A Useful Tool for Summarizing Similarity Measurements In order to better appreciate and evaluate the examples given in the early part of this talk, we will now introduce the dendrogram. The similarity between two objects in a dendrogram is represented as the height of the lowest internal node they share.
I have written some code for us to play with. • I am made random data in 2D and clustered it with a dendrogram. • You can think of the datapoints as the locations on Starbucks in Riverside, or something more abstract, like insect features.. • You can see: • ‘1’ and ‘5’ are very close in the 2D plot and, the dendrogram reflects this. • ‘9’ is far from everything in the 2D plot and, the dendrogram reflects this. • ‘5’ is closer to ‘3’ that it is to ‘8’ in the 2D plot, and the dendrogram reflects this. • etc. function Hierarchical_Experiments() subplot(2,1,1); X = randn(10,1); Y = randn(10,1); for i = 1 : length(X) text(X(i),Y(i),num2str(i)); end set(gca,'Xlim',[min(X)-0.2 max(X)+0.2],'Ylim',[min(Y)-0.2 max(Y)+0.2],'XTick', [],'YTick', []) axis square subplot(2,1,2); [H, T] = dendrogram(linkage(pdist([X, Y],'cityblock'),'average')); end
Now I have pushed half the data strongly to the right. • This is a bit like Starbucks in Irvine, and Starbucks in Riverside, far to the east. • By just looking at the dendrogram, I would be willing to say that there are two strong clusters here. • Informally, the height of the subtree that contains {1,2,3,4,5} is quite small compared to the length of the branch that connects it to the rest of the data. function Hierarchical_Experiments() subplot(2,1,1); X = [randn(5,1); randn(5,1)+10]; Y = [randn(5,1); randn(5,1)]; …
Now I have pushed half the data strongly to the right, and made the right side data have less variance. • Think of Starbucks in Montana (left) and Starbucks in New York (right). • By just looking at the dendrogram, I would be willing to say that there are two strong clusters here, and one cluster is much tighter than the other. function Hierarchical_Experiments() subplot(2,1,1); X = [randn(5,1); (randn(5,1)/5)+10]; Y = [randn(5,1); (randn(5,1)/5)];
There is only one dataset that can be perfectly clustered using a hierarchy… (Bovine:0.69395, (Spider Monkey 0.390, (Gibbon:0.36079,(Orang:0.33636,(Gorilla:0.17147,(Chimp:0.19268, Human:0.11927):0.08386):0.06124):0.15057):0.54939);
Do Trees Make Sense for non-Biological Objects? Hellenic Armenian Persian Persian Hellenic Armenian Gibbon Sumatran Orangutan Orangutan Gorilla Human Pygmy Chimp Chimpanzee “Armenian borrowed so many words from Iranian languages that it was at first considered a branch of the Indo-Iranian languages, and was not recognized as an independent branch of the Indo-European languages for many decades” The answer is “Yes”. There are increasing theoretical and empirical results to suggest that phylogenetic methods work for cultural artifacts. • Does horizontal transmission invalidate cultural phylogenies?Greenhill, Currie & Gray. • Branching, blending, and the evolution of cultural similarities and differences among human populations. Collard, Shennan, & Tehrani. ..results show that trees constructed with Bayesian phylogenetic methods are robust to realistic levels of borrowing
On trick to text the applicably of phylogenetic methods outside of biology is to test on datasets for which you know the right answer by other methods. “Canadian Football is historically derived from the ancestor of rugby, but today closely resembles the American versions of the game. In this branch of the tree geography has trumped deeper phylogenetic history.” Here the results are very good, but not perfect. Gray, RD, Greenhill, SJ, & Ross, RM (2007). The Pleasures and Perils of Darwinizing Culture (with phylogenies). Biological Theory, 2(4)
Note that hierarchies are commonly used to organize information, for example in a web portal. Yahoo’s hierarchy is manually created, we will focus on automatic creation of hierarchies in data mining. Business & Economy B2B Finance Shopping Jobs Aerospace Agriculture… Banking Bonds… Animals Apparel Career Workspace
A Demonstration of Hierarchical Clustering using String Edit Distance Pedro(Portuguese) Petros (Greek), Peter (English), Piotr (Polish), Peadar (Irish), Pierre (French), Peder (Danish), Peka (Hawaiian), Pietro (Italian), Piero (Italian Alternative), Petr (Czech), Pyotr (Russian) Cristovao(Portuguese) Christoph (German), Christophe (French), Cristobal (Spanish), Cristoforo (Italian), Kristoffer (Scandinavian), Krystof (Czech), Christopher (English) Miguel(Portuguese) Michalis (Greek), Michael (English), Mick (Irish!) Piotr Peka Mick Peter Piero Pedro Pyotr Peder Pierre Pietro Petros Miguel Peadar Krystof Michael Michalis Crisdean Cristobal Christoph Cristovao Kristoffer Cristoforo Christophe Christopher
Pedro(Portuguese/Spanish) Petros (Greek), Peter (English), Piotr (Polish), Peadar (Irish), Pierre (French), Peder (Danish), Peka (Hawaiian), Pietro (Italian), Piero (ItalianAlternative), Petr (Czech), Pyotr (Russian) Piotr Peka Peter Pedro Piero Pyotr Peder Pierre Pietro Petros Peadar
South Georgia & South Sandwich Islands Serbia & Montenegro (Yugoslavia) St. Helena & Dependencies U.K. AUSTRALIA ANGUILLA FRANCE NIGER INDIA IRELAND BRAZIL • Hierarchal clustering can sometimes show patterns that are meaningless or spurious • For example, in this clustering, the tight grouping of Australia, Anguilla, St. Helena etc is meaningful, since all these countries are former UK colonies. • However the tight grouping of Niger and India is completely spurious, there is no connection between the two.
South Georgia & South Sandwich Islands Serbia & Montenegro (Yugoslavia) St. Helena & Dependencies U.K. AUSTRALIA ANGUILLA FRANCE NIGER INDIA IRELAND BRAZIL • The flag of Niger is orange over white over green, with an orange disc on the central white stripe, symbolizing the sun. The orange stands the Sahara desert, which borders Niger to the north. Green stands for the grassy plains of the south and west and for the River Niger which sustains them. It also stands for fraternity and hope. White generally symbolizes purity and hope. • The Indian flag is a horizontal tricolor in equal proportion of deep saffron on the top, white in the middle and dark green at the bottom. In the center of the white band, there is a wheel in navy blue to indicate the Dharma Chakra, the wheel of law in the Sarnath Lion Capital. This center symbol or the 'CHAKRA' is a symbol dating back to 2nd century BC. The saffron stands for courage and sacrifice; the white, for purity and truth; the green for growth and auspiciousness.
We can look at the dendrogram to determine the “correct” number of clusters. In this case, the two highly separated subtrees are highly suggestive of two clusters. (Things are rarely this clear cut, unfortunately)
One potential use of a dendrogram is to detect outliers The single isolated branch is suggestive of a data point that is very different to all others Outlier
(How-to) Hierarchical Clustering Since we cannot test all possible trees we will have to heuristic search of all possible trees. We could do this.. Bottom-Up (agglomerative): Starting with each item in its own cluster, find the best pair to merge into a new cluster. Repeat until all clusters are fused together. Top-Down (divisive): Starting with all the data in a single cluster, consider every possible way to divide the cluster into two. Choose the best division and recursively operate on both sides. The number of dendrograms with n leafs = (2n -3)!/[(2(n -2)) (n -2)!] Number Number of Possible of Leafs Dendrograms 2 1 3 3 4 15 5 105 ... … • 34,459,425
0 4 8 8 7 7 0 2 0 3 3 0 1 0 4 We begin with a distance matrix which contains the distances between every pair of objects in our database. D( , ) = 8 D( , ) = 1
Bottom-Up (agglomerative): Starting with each item in its own cluster, find the best pair to merge into a new cluster. Repeat until all clusters are fused together. Consider all possible merges… Choose the best …
Bottom-Up (agglomerative): Starting with each item in its own cluster, find the best pair to merge into a new cluster. Repeat until all clusters are fused together. Consider all possible merges… Choose the best … Consider all possible merges… Choose the best …
Bottom-Up (agglomerative): Starting with each item in its own cluster, find the best pair to merge into a new cluster. Repeat until all clusters are fused together. Consider all possible merges… Choose the best … Consider all possible merges… Choose the best … Consider all possible merges… Choose the best …
Bottom-Up (agglomerative): Starting with each item in its own cluster, find the best pair to merge into a new cluster. Repeat until all clusters are fused together. Consider all possible merges… Choose the best … Consider all possible merges… Choose the best … Consider all possible merges… Choose the best …
We know how to measure the distance between two objects, but defining the distance between an object and a cluster, or defining the distance between two clusters is non obvious. • Single linkage (nearest neighbor):In this method the distance between two clusters is determined by the distance of the two closest objects (nearest neighbors) in the different clusters. • Complete linkage (furthest neighbor):In this method, the distances between clusters are determined by the greatest distance between any two objects in the different clusters (i.e., by the "furthest neighbors"). • Group average linkage:In this method, the distance between two clusters is calculated as the average distance between all pairs of objects in the two different clusters. • Wards Linkage: In this method, we try to minimize the variance of the merged clusters
Single linkage Average linkage Wards linkage
A B C D E (A,((B,C),(D,E))) A B C D E