Download
1 / 4
40 likes | 79 Views
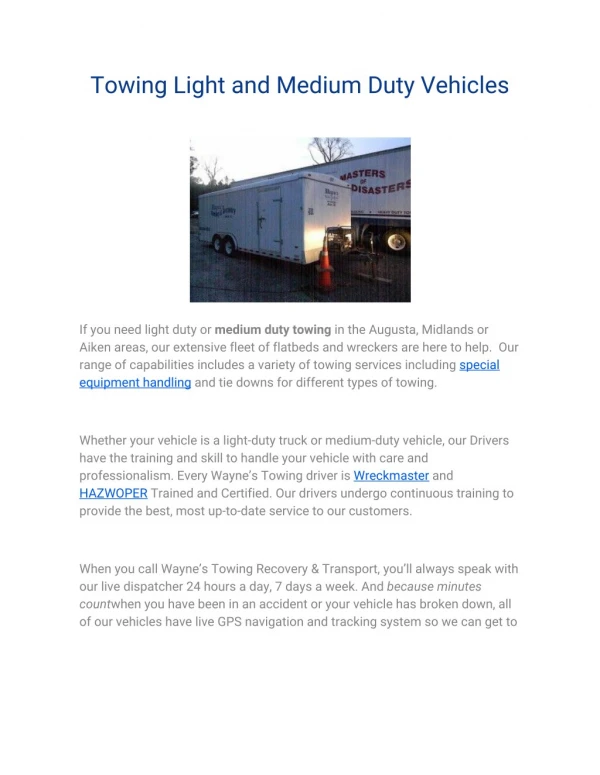
Learn about the growth, production, and environmental impact of light-duty vehicles (LDVs). Explore the market dynamics, emissions data, and potential technologies for reducing GHGs. Understand the challenges and opportunities in achieving sustainable mobility in LDVs.

E N D
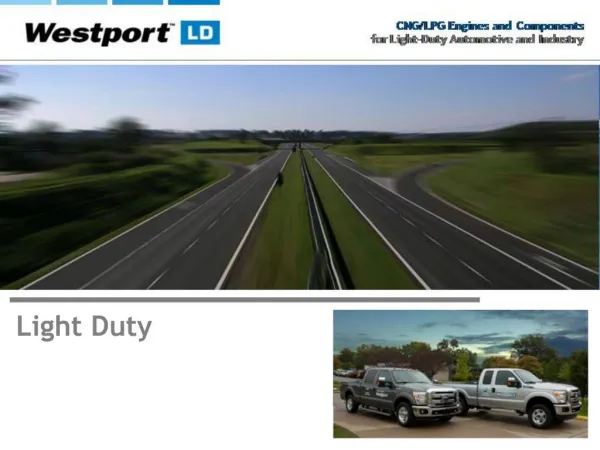
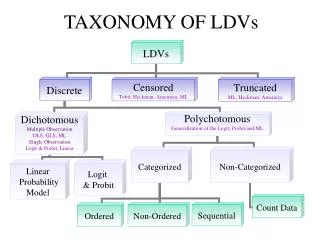
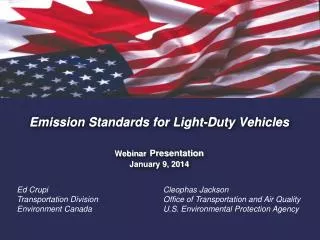
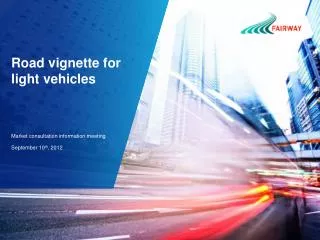
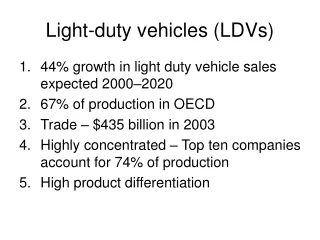
Light-duty vehicles (LDVs) • 44% growth in light duty vehicle sales expected 2000–2020 • 67% of production in OECD • Trade –$435 billion in 2003 • Highly concentrated –Top ten companies account for 74% of production • High product differentiation
LDV emissions • Single technology platform (internal combustion engine) inherently inefficient: only 15% of energy is captured • LDVs – 6.7% of total anthropogenic GHG emissions (total road transport = 11.3%) • 30% growth in LDV emissions expected 2000–2020 • Theuseof automobiles accounts for 90% of their emissions • Emissions intensities vary considerably by region: 230–400 gCO2/km
Well-to-wheels GHG emissions intensity of automobile stock by region Source: World Business Council for Sustainable Development, Sustainable Mobility Project
Hypothetical potential of individual technologies to lower road transport Well-to-Wheels CO2 emissions relative to the reference case Source: Mobility 2030, Figure 4.7