Analysing your data
190 likes | 207 Views
Learn how to analyze your PsychoPy data in Excel for efficient data processing. Understand working with worksheets, sorting cells, moving data, relabeling columns, calculating averages, and utilizing Excel's functionalities.

Analysing your data
E N D
Presentation Transcript
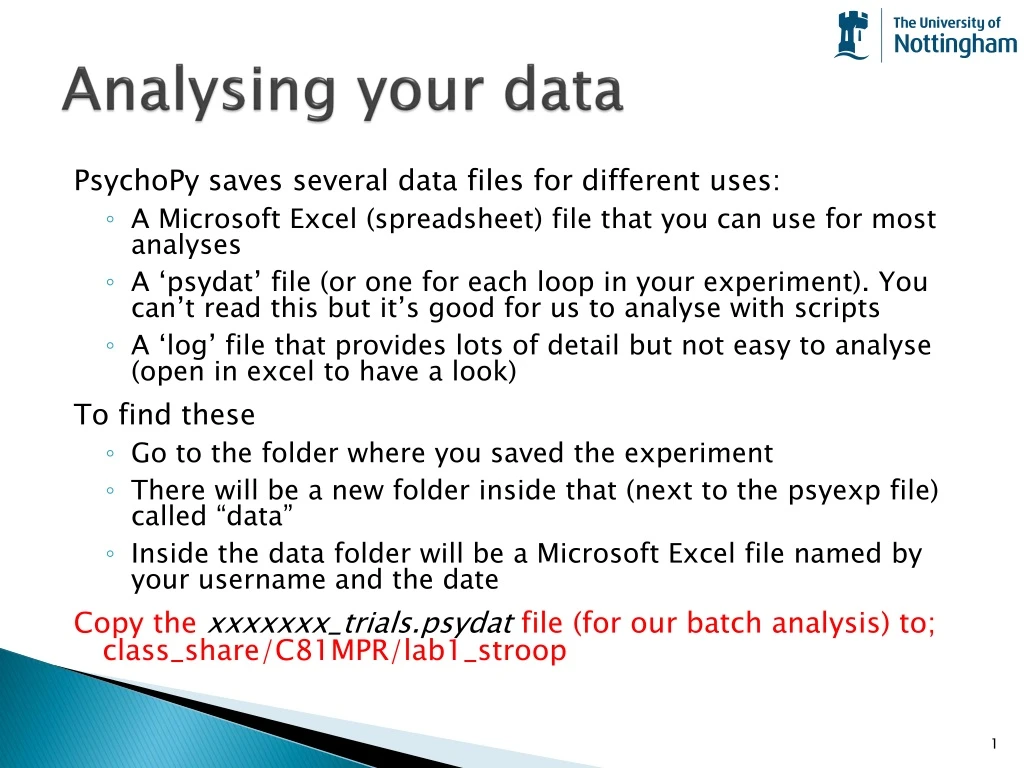
Analysing your data PsychoPy saves several data files for different uses: • A Microsoft Excel (spreadsheet) file that you can use for most analyses • A ‘psydat’ file (or one for each loop in your experiment). You can’t read this but it’s good for us to analyse with scripts • A ‘log’ file that provides lots of detail but not easy to analyse (open in excel to have a look) To find these • Go to the folder where you saved the experiment • There will be a new folder inside that (next to the psyexp file) called “data” • Inside the data folder will be a Microsoft Excel file named by your username and the date Copy the xxxxxxx_trials.psydatfile (for our batch analysis) to;class_share/C81MPR/lab1_stroop
Using Excel • Having saved that copy to the class_share folder go back to the Excel (xxxxx.xlsx) file and open it (e.g. with double-click) • That opens Microsoft Excel, a spreadsheet application, which allows you to work with data in a large table format to perform simple analyses • To analyse your data today you could simply use a calculator but, in the long run, learning to use Excel will save you a lot of time!
Worksheets • In the Excel file that was saved by PsychoPy you’ll find two worksheets (see the tab at the bottom), one for the practice trials, one for the main trials • Select the worksheet for the main trials
PsychoPy data files In the data files each row represents a different trial type. We have 12 trial types here. The columns give information about the stimuli and the responses. The top row tells us what is in each column
PsychoPy data files • Some of the information is about the parameters that we used to control the stimuli
PsychoPy data files • This column tells us how many trials were run of each type.
PsychoPy data files This row is too narrow for the title to be fully visible, but if you click on that cell it reads, resp.corr_mean. This row gives us the fraction of correct answers
PsychoPy data files The next header says resp.corr_raw and gives 5x12 values (5 repeats of 12 conditions). A zero means the subject got the answer wrong that trial, a one means they got it right.
Analysing the Stroop data • For the Stroop task we want to know about reaction times in the different conditions • If you look way over to the right you’ll find a column called resp.rt_mean (and resp.rt_raw) which show the reaction times • Let’s copy the congruence and the resp.rt_mean columns to be closer together
Copying a group of cells Select the cells specifying the congruence, including the header (click on the top cell and then press Shift and click on the bottom cell that you want) Now go to >Edit>Copy or press Ctrl-C Go to cell E16 and paste Now also copy the cells that give the rt_mean next to these ones to get this
Sorting cells Select the cell ‘congruent’ (E16) Find the Sort button in the toolbar (you may need to select the Data tab first): Your data should now be sorted by congruency Caution: whenever you sort data make sure you can see which data have been sorted – if you have a subset of data selected then only that gets included in the sort and your rows won’t correspond up any more!!
Moving cells • To move the incongruent RTs into a different column: • Select the RTs for that condition • hover your mouse over the edge of the selection so it changes to this symbol • when you see the ‘move’ symbol you can drag that cell up and to the right to align with congruent • (if it goes wrong just press Ctrl-Z to undo)
Relabel your columns • (You’d be amazed how easy it is to lose track of your workings if the labels aren’t right)
Taking the average • Calculate the mean of the congruent RTs(Excel calls this the average) • Click on cell F24 • Insert the ‘average’ formula: • On Windows, select the ‘Formulas’ tab, then press the Insert Function button
Taking the average • A dialog box appears where you need to double-click the function you want (AVERAGE) This brings up a second dialog, where you can select (or type) the cells you want to take an average of We want the range F16:F22 (Excel may have guessed this already)
Excel makes life easy • When you press OK, the mean should have been inserted in the cell • You could have done that on a calculator, but this is quicker, especially if you have lots of values • Even better though, see what happens when you copy that cell (F24) and paste it into cell (G24) • Excel calculates that average as well!
Excel relative references • How did that work?! • When you entered the range of cells for the first average, you actually entered a ‘relative reference’: • Excel interprets the range not as F16:22 but as “the 6 cells above me, one cell away” • When that is copied and pasted somewhere new it looks at the same relative location for the formula • If we had typed $F$16:$F$22 we would have got fixed locations (absolute references) for those cells instead
Other useful Excel functions • Excel allows you to calculate lots of different things in a similar way, using insert function: • COUNT (the number of cells containing a value) • SUM • MODE • MEDIAN • STDEV (std. dev. Using N-1 normalisation) • STDEVP (std. dev. Using N normalisation) • CORREL (coefficient of correlation) • …
Now… • Hopefully you can now see the average response time across all your congruent and incongruent trials. • Was there a difference between them?