Download
1 / 30
320 likes | 1.03k Views
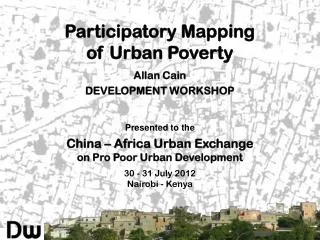
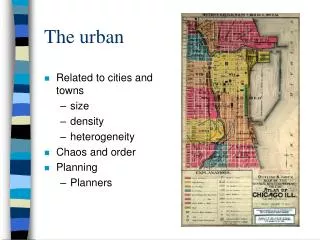
Mapping the Urban Image. What is your “image of the city”?. Intangible model of the city Designed for practicality not precision Personal “Under construction” Made up of certain elements (Kevin Lynch 1960) Paths Landmarks Nodes Districts Edges . What purposes does it serve?.

E N D
What is your “image of the city”? • Intangible model of the city • Designed for practicality not precision • Personal • “Under construction” • Made up of certain elements (Kevin Lynch 1960) • Paths • Landmarks • Nodes • Districts • Edges
What purposes does it serve? • Aids navigation • Guides social interaction • Prevents feeling lost • Helps make the city feel like “home”
Alternative names • Image (Kevin Lynch, 1960) • imageability • path, edge, landmark, node, district • some urban environments are more imageable than others • Mental maps • Peter Gould (preference surfaces) • Rodney White • Cognitive maps • Roger Downs and David Stea • Reg Golledge
Mental MapsGould and White 1986 Preference Surface from Minnesota Ignorance Surface from Pennsylvania
What areas do you know: • Well • Moderately well • Not at all • What areas do you consider: • Great • Good • OK • Not so hot • Really awful
Problems with methodology? • Link between mental map and sketch map is taken for granted, assumed rather than problematized • Several variables not examined: • artistic ability (varies by education, age, etc.) • practice drawing maps • perception of task (e.g. level of probing by researcher) • willingness to draw (e.g. amount of free time)
Strengths of methodology? • Reveals individual differences in experience • Builds rapport between researcher and subject • A fun way to initiate broader discussion about the urban environment
Why might mental maps differ from person to person? urban experiences differ from person to person
Can you think of any other personal variables related to physical ability? • How would each of these affect someone’s image of the city? • blind or visually impaired • partially or completely deaf • mobility impaired • developmentally impaired • mentally ill • substance abusers • homeless
How could the city be made more accessible for: • children • elderly • women • handicapped • poor & unemployed • those without cars