Download
1 / 44
440 likes | 630 Views
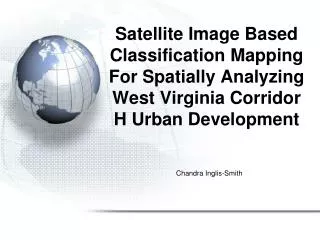
Satellite Image Based Classification Mapping For Spatially Analyzing West Virginia Corridor H Urban Development. Chandra Inglis-Smith. Introduction and Background. Study Area. The study area is all of Corridor H. Barbour Co. Tucker Co. Grant Co. Lewis Co. Hardy Co. Upshur Co.

E N D
Satellite Image Based Classification Mapping For Spatially Analyzing West Virginia Corridor H Urban Development Chandra Inglis-Smith
Study Area • The study area is all of Corridor H. Barbour Co. Tucker Co Grant Co Lewis Co Hardy Co Upshur Co Randolph Co
Study Area • Earliest Euro-American Settlements – late 18th century, followed patterns established by Native Americans. • Transportation consisted of dirt roads and trails till mid 18th century with development of turnpikes and the railroad in the 20th century. • Main Economic Focus • Agriculture • Cattle,grain corn, poultry • Resource Extraction • Timber, Coal and coke
Overview of Corridor H • Part of the Appalachian Development Highway System a program run by the Appalachian Regional Commission (ARC). • The main goal of Corridor H is to foster economic growth in the region, by improving east-west travel, inter-community travel, emergency response time, freight travel, and increasing access to recreational facilities in the area by linking the existing north-south interstates in the region.
Remote Sensing • Satellite Systems collect data in multiple electro-magnetic spectrum bands (wavelengths). • Ex) visible and near to mid infrared • Resolution Types: • Spectral • Temporal www.eomonline.com • Spatial ds9.ssl.berkeley.edu www.wvview.org www.uni-kiel.de/.../ ch2/images/reichstag2bit.gif • Radiometric
Change Detection • Change detection is the process of identifying differences in the state of an object or phenomenon by observing it at different times. (Singh, 1989 in Bottomley, 22) • Change Detection Methods • Map Algebra, Direct Multi-date Classification, Post Classification Comparison • Change detection is useful for: • land use analysis, monitoring shifting cultivation, assessment of deforestation, disaster monitoring, day/night analysis of thermal characteristics and for tracking urban and economic growth.
Purpose and Objective • Purpose: To look at change in the study area over time by mapping present day West Virginia and comparing it to the past through the use of satellite imagery and GIS data. • Objective: To perform analysis on two datasets obtained from the USGS of the study area from the years 1987 and 2005 to determine if remote sensing techniques, specifically change detection, could be utilized to measure urban development (economic development) and isolate potential locations of future economic growth along Corridor H.
Data • Landsat Satellite Imagery • Vector Data • NLCD Dataset
File Conversion • Three Software Packages: ErMapper, IDRISI, ESRI ArcGIS • utilized ASCII (.asc) to import and export • “.ers” files loaded directly into ESRI ArcMap • Two shapefiles were converted for use in ErMapper and IDRISI • Corridor H polyline • Corridor H boundary polygon
Preprocessing • Geometric Rectification • Registration coordinates were manually corrected. • Polynomial Transformation using 2005 image as the base image.
PCA • Principal Components Analysis (PCA) • A statistical procedure of data compression. The 1st principal component usually accounts for most of the variability in the data. • Allows you to pick out patterns and relationships in the variables. • Allows you to reduce the size of your dataset with no significant information loss. • Isolates and defines features more thoroughly than conventional band combinations.
Radiometric Normalization • Used histogram matching algorithms in ERMapper on the PCA datasets. • Transformed the final output histograms of the red, green, blue, PCA 1987 layers to match the final output histograms of the 2005 layer.
Unsupervised Classification • Images classified in ErMapper • maximum number of 15 classes • 99 iterations • 0.1% for minimum members in a class • all others left as default • Classified images returned, clusters were labeled and identified as to land cover/use type • Vector • NLCD • SAMB
Accuracy Assessment • Non site-specific error matrix/confusion matrix • quantitatively assessed the NLCD reference layer and the classified images. • Utilized ESRI, Excel, & Access • Four accuracy assessments were derived: Omission Error (producer’s accuracy) Commission Error (user’s accuracy) Overall Accuracy • Kappa Analysis (Khat)
Figure 7: Results of Spatial Analyst Diff. Image Comparison • Done in ESRI using the Spatial Analyst procedure DIFF
Image Generalization • Spatial Analysis in ESRI • Majority Filter: Land2 = majorityfilter ([landiff], eight, half) • Setnull: LndCvr56 = setnull ([Land2] <5, [Land2]) • Region Group: regiongroup ([LndCvr56]) • Setnull: setnull ([Region1].count le 10, lndcvr56) • ZonalArea: zonalarea ([nosmlarea]) • * 0.0001 , * 0.000001 , * 0.0002471
Preprocessing • The results of the geometric registration returned a Root Mean Square error (RMS) of between 0.01 and 0.06 pixels. • This results in an error of less than 55 square meters or 0.014 acres • Compared to the size of the study area, 10,414,210,255 square meters or 2,573,351 acres, the error is minor in comparison
PCA • Bands 3, 4, & 5 • Bands 2, 3, & 4 • PCA’s 1, 2, & 3
Radiometric Normalization • Before classifying the PCA images from Path 17 1987 and 2005 were radiometrically normalized to standardize for effects outside of actual real surface change. • The result was similar radiometric responses across feature types on which to base the classifications.
Classification • Images allowed the same parameters • 15 classes • 99 iterations • 0.1% for minimum members in a class • pixels with a zero value were set to null • all other options were left as default. • Path 17 1987 PCA image returned 10 classes • Path 17 2005 PCA Image returned 12 classes • Classified Images compared to NLCD dataset and SAMB Aerial Photography
Classification • The images were then reclassified into the exact same six classes.
1987 NLCD 2005
Accuracy Assessment • Errors in the accuracy may be from: • geometric registration • normalization process • classification process • accuracy assessment process • or the NLCD Dataset
Moorefield Commercial and H construction as compared to 2003 and 1991
The Objective • To look at change in the study area over time by mapping present day West Virginia and comparing it to the past through the use of satellite imagery, GIS data and Remote Sensing change detection techniques. • To determine if economic development as seen through urban change can be measured along Corridor H.
Conclusion • The objective was accomplished. • Provides a baseline for future analysis. • Can be combined with more traditional methods of economic development measurement. • The use of this data can help to focus these economic studies, and supply spatial relevance to changes in rural Appalachia