Download
1 / 35
350 likes | 585 Views
IE4803-A: Advanced Manufacturing Systems Modeling and Analysis Fall 2014. Instructor: Spyros Reveliotis e-mail: spyros@isye.gatech.edu homepage: www.isye.gatech.edu /~ spyros. “ Course Logistics ”. TA: TBA Office Hours: MW 2 -3pm or by appointment

E N D
IE4803-A: Advanced Manufacturing Systems Modeling and AnalysisFall2014 Instructor: Spyros Reveliotis e-mail: spyros@isye.gatech.edu homepage: www.isye.gatech.edu/~spyros
“Course Logistics” • TA:TBA • Office Hours: MW2-3pm or by appointment • Course Prerequisites: stochastic modeling (IE 3232). • Course policies: • Homework: 20% • Midterm I: 25% • Midterm II: 25% • Final: 30% • Academic Honor Code must be respected in all facets of the course • Make-up exams and incompletes only in case of officially documented emergencies • Reading Materials: • Course Textbook:G. L. Curry and R. M. Feldman, “Manufacturing Systems Modeling and Analysis” (2nd ed.), Springer, 2011 • Course slides and any other material posted at my homepage or at the library electronic reserves
Reading Assignment • Read Chapters 1 and 2from your textbook.
Course Objectives(What is this course all about?) • Introduce the students to an in-depth modeling and analysis of the workflow dynamics that shape the operation and the performance of contemporary production systems. • Offer the students the experience of applying their formal background in stochastic modeling and analysis to practical problems and applications. • In fact, a further intention of the course is to teach the students not only the particular models and algorithms that are covered in it, but also the thinking processes and the broader methodology that underlie the development of the presented results. • Finally, while the course material will be motivated and presented primarily through applications drawn from the manufacturing domain, for specificity and concreteness, this material finds further applicability in any other application domain involving a structured workflow, like in health care and other service-related industries.
Inputs Outputs • Materials • Capital • Labor • Manag. Res. • Goods • Services Organization Stage 1 Stage 2 Stage 4 Stage 3 Stage 5 Our abstraction of the Production System • Theproduction systemas a transformation process (physical, locational, physiological, intellectual, etc.) • The production system as a process network Suppliers Customers
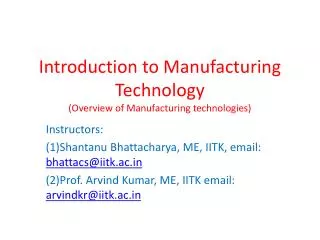
Discrete Part Manufacturing Systems The end product is the assemblage of a number of components and sub-assemblies, either produced in- house or procured from outside. Frame Building Frame Machining Frame Painting Engines and Transmissions TESTING Seats Cell Oil Tank Cell Steering Wheel Cell Shocks Cell Doors Cell Wheels Cell “Packaging”
Production Flow in discrete part manufacturing Main Frame Part 1 Process Plan O-1-1 O-1-2 O-1-3 O-1-4 A-1 Part 2 Process Plan A-2 O-2-1 O-2-2 O-2-3 Part 3 (Procured externally) A-3 Part 4 Process Plann O-4-1 O-4-2 O-4-3 A-4 I-1 Part 5 Process Plan O-5-1 O-5-2 A-5 End Product
A typical Organization of the Production Activity in High-Volume Discrete-Part Manufacturing Assembly Line 1: Product Family 1 Raw Material & Comp. Inventory S1,1 S1,i S1,n Finished Item Inventory S1,2 Fabrication (or Backend Operations) Dept. 1 Dept. 2 Dept. j Dept. k S2,1 S2,2 S2,i S2,m Assembly Line 2: Product Family 2
Fixed Product Layout • Workpiece remains fixed and the various processes are brought to it • Used primarily in ship-building. • Sometimes can be the preferred layout when high levels of precision are in order. • Production activity is controlled through project management related practices.
Product Layout or Flowline • Each part has its own dedicated production line. • The line for each part is organized in a way that facilitates the corresponding production flow. • Easy to manage and supervise • However, a capital-intensive proposition • Production volumes must be sufficiently large
Process Layout or Job Shop • Facility is organized into departments supporting different functions • Production lots are visiting these departments according to their processing needs (process plans) • Can result in high equipment utilization and operational flexibility • But it also incurs extensive material handling and long production times • Necessitates involved production planning and scheduling • Appropriate for low-volume production of a large, volatile portfolio of parts
Group or Cellular Layout • Parts are grouped into families based on the similarity of their processing requirements. • Each family gets a dedicated production facility, known as production cell. • Typically cells operate as switching flowlines, with switching taking place between the production of batches of different part types. • Frequently switching can involve substantial effort and time, known as setup time. • Provide a “middle ground” between a product and a process layout, in terms of operational efficiency and investment
Manufacturing Flowlines:A working abstraction • Flow line: A sequence of workstations supporting the production of a single part type. • Each workstation consists of one or more identical servers executing one particular stage of the entire production process. • processing time at each workstation variable due to inherent process variability but also due to operational detractors, like • machine downtime, • operator unavailability, • experienced set-up times, • preventive maintenance, etc.
Flowline Performance Measures • Production rate or throughput, i.e., the number of parts produced per unit time • Line capacity, i.e., the maximum sustainable production rate • Line (expected) cycle time, i.e., the average time that is spend by any part into the line (this quantity includes both, processing and waiting time). • Average Work-In-Porcess (WIP) accumulated at different stations • Expected utilization of the station servers. Remark:The above performance measures provide a link between the directly quantifiable and manageable aspects and attributes of the line and the primary strategic concerns of the company, especially those of responsiveness and cost efficiency.
The major functional units of a modern organization Strategic Planning: defining the organization’s mission and the required/perceived core competencies Production/ Operations: product/service creation Finance/ Accounting: monitoring of the organization cash-flows Marketing: demand generation and order taking
Defining the Corporate Strategy Responsiveness (Reliability; Quickness; Flexibility; e.g., Dell, Overnight Delivery Services) Competitive Advantage through which the company market share is attracted Cost Leadership (Price; e.g., Wal-Mart, Southwest Airlines, Generic Drugs) Differentiation (Quality; Uniqueness; e.g., Luxury cars, Fashion Industry, Brand Name Drugs)
A flowlineclassification based on the applied workflow control scheme Flowline Synchronous Asynchronous Push e.g., Asynchronous Transfer Line Pull e.g., KANBAN or CONWIP lines
Synchronous Transfer Lines • Production is paced by an interconnecting conveyor system • No WIP accumulation at the different stations • Production control logic is hardwired in the supporting conveyor system • Line expensive and inflexible • Typically used for high-throughput final assembly
Asynchronous Flowlines and the Push vs. Pull dilemma • Part advancement between the different stations is not synchronized. • Need for buffering capacity at the different stations to accommodate the resulting WIP. • Two primary control mechanisms • Push: • Lots are released into the line according to an externally specified production plan. • A lot that has completed processing at its current station will immediately advance to the next one. • Pull: • Target WIP levels are specified for different line segments. • Lot advancements that can cause the exceeding of some target WIP levels are blocked. • A drop from the target WIP level is a signal for replenishment.
Asynchronous Flowlines and the Push vs. Pull dilemma (cont.) • Push properties • Directly connected to production planning • Can easily accommodate changes in target production • (In its basic definition), it lacks a feedback mechanism that can facilitate reaction to operational contingencies • As a result, congestion is possible
Asynchronous Flowlines and the Push vs. Pull dilemma (cont.) • Pull properties • Main control variable is WIP • The enforced WIP caps make the line reactive to contingencies and prevent congestion • Need for some (analytical) machinery to translate target production plans to target WIP levels • Need considerable stability of the production plans, since frequent changes of the target WIP levels can lead to chaotic behavior.
Asynchronous Transfer Lines W1 W2 W3 TH TH TH TH B1 M1 B2 M2 B3 M3 • Some important issues: • What is the maximum throughput that is sustainable through this line? • What is the expected cycle time through the line? • What is the expected WIP at the different stations of the line? • What is the expected utilization of the different machines? • How does the adopted batch size affect the performance of the line? • How do different detractors, like machine breakdowns, setups, and maintenance, affect the performance of the line?
Station 1 Station 2 Station 3 KANBAN-based production lines • Some important issues: • What is the throughput attainable by a certain selection of KANBAN levels? • What is the resulting cycle time? • How do we select the KANBAN levels that will attain a desired production rate? • How do we introduce the various operational detractors into the model?
CONWIP-based production lines FGI Station 1 Station 2 Station 3 • Some important issues: • Same as those for the KANBAN model, plus • How can we compare the performance of such a system to that of an asynchronous transfer line and/or a KANBAN-based system?
Tentative Course Outline • Introduction: Course Objectives, Context, and Outline • Manufacturing System as a Transformation Process, Operations Management, and the role of Corporate Strategy • Contemporary high-volume (discrete-part) manufacturing systems and their modeling as stochastic systems • A taxonomy of the considered manufacturing systems based on their workflow management: Synchronous vs. Asynchronous, and Push vs. Pull and CONWIP models • Course overview • The disrupting role of variability and the need for stochastic modeling • Design of Synchronous Manufacturing Systems / Assembly Line Balancing • Modeling, Analysis and Design of Single-Station, Push-Controlled Manufacturing Systems as G/G/m queues • Modeling Preemptive and Non-Preemptive Operational Contingencies • Extension of the results to multi-stage, single-product, push-controlled manufacturing systems • Modeling and analysis of multiple-product manufacturing systems • Batching schemes and their complications • Modeling and analysis of CONWIP-controlled manufacturing systems as closed queueing networks • Modeling and analysis of serial production lines with blocking (due to limited buffers or KANBAN control) through decomposition
TH B1 M1 Analyzing a single workstation with deterministic inter-arrival and processing times Case I: ta = tp = 1.0 WIP 1 TH = 1 part / time unit Expected CT = tp t 1 2 3 4 5 Arrival Departure
TH B1 M1 Analyzing a single workstation with deterministic inter-arrival and processing times Case II: tp = 1.0; ta = 1.5 > tp WIP Starvation! 1 TH = 2/3 part / time unit Expected CT = tp t 1 2 4 5 3 Arrival Departure
TH B1 M1 3 2 1 t 1 2 3 4 5 Arrival Departure Analyzing a single workstation with deterministic inter-arrival and processing times Case III: tp = 1.0; ta = 0.5 WIP Congestion! TH = 1 part / time unit Expected CT
TH B1 M1 A single workstation with variable inter-arrival times Case I: tp=1; taN(1,0.12) (ca=a / ta = 0.1) WIP 3 2 TH < 1 part / time unit Expected CT 1 t 1 2 3 4 5 Arrival Departure
TH B1 M1 WIP 3 2 1 t 1 2 3 4 5 Arrival Departure A single workstation with variable inter-arrival times Case II: tp=1; taN(1,1.02) (ca=a / ta = 1.0) TH < 1 part / time unit Expected CT
TH B1 M1 WIP 3 2 1 t 1 2 3 4 5 A single workstation with variable processing times Case I: ta=1; tpN(1,1.02) TH < 1 part / time unit Expected CT Arrival Departure
Remarks • Synchronization of job arrivals and completions maximizes throughput and minimizes experienced cycle times. • Variability in job inter-arrival or processing times causes starvation and congestion, which respectively reduce the station throughput and increase the job cycle times. • In general, the higher the variability in the inter-arrival and/or processing times, the more intense its disruptive effects on the performance of the station. • The coefficient of variation (CV) defines a natural measure of the variability in a certain random variable.
TH B1 M1 B2 M2 WIP 3 2 1 t 1 2 3 4 5 The propagation of variability W1 W2 Case I: tp=1; taN(1,1.02) Case II: ta=1; tpN(1,1.02) WIP 3 2 1 t 1 2 3 4 5 W1 arrivals W1 departures W2 arrivals
Remarks • The variability experienced at a certain station propagates to the downstream part of the line due to the fact that the arrivals at a downstream station are determined by the departures of its neighboring upstream station. • The intensity of the propagated variability is modulated by the utilization of the station under consideration. • In general, a highly utilized station propagates the variability experienced in the job processing times, but attenuates the variability experienced in the job inter-arrival times. • A station with very low utilization has the opposite effects.