Download
1 / 44
470 likes | 685 Views
Drag Reduction of MAV by Biplane Effect. Chinnapat THIPYOPAS Graduate student, Department of Aerodynamics and Jean-Marc MOSCHETTA Associate Professor of Aerodynamics, Department of Aerodynamics Ecole Nationale Supérieure de l’Aéronautique et de l’Espace (SUPAERO)

E N D
Drag Reduction of MAV by Biplane Effect Chinnapat THIPYOPAS Graduate student, Department of Aerodynamics and Jean-Marc MOSCHETTA Associate Professor of Aerodynamics, Department of Aerodynamics Ecole Nationale Supérieure de l’Aéronautique et de l’Espace (SUPAERO) 10 Av. Ed. Belin, Toulouse, France P1/29
Contents • Introduction • Part 1 Optimization - (Experimental) - (Numerical) • Part 2 Biplane Combinations • Part 3 Propeller Influence • Conclusions Department of Aerodynamics SUPAERO P2/29
Contents • Introduction • Part 1 Optimization - (Experimental) - (Numerical) • Part 2 Biplane Combinations • Part 3 Propeller Influence • Conclusions Department of Aerodynamics SUPAERO P3/29
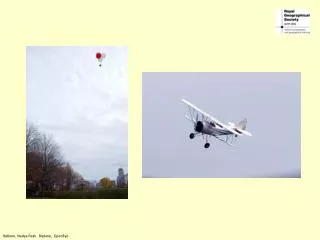
Minus-Kiool57g - 20.6 cm Plaster64g - 23 cm Monoplane MAV concepts Department of Aerodynamics SUPAERO P4/29
Department of Aerodynamics SUPAERO Maxi-Kiool, SUPAERO Induced Drag 76%* Drenalyne, SUPAERO Plaster, SUPAERO Biplane Concept !! 100 % 20-30 % 70-80 % Monoplane-MAVs Total Drag = Parasite Drag + Induced drag P5/29 * J.L’HENAFF, SUPAERO 2004
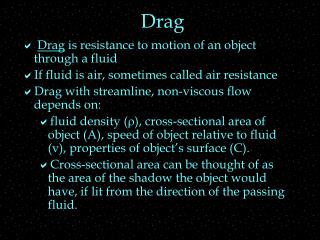
Constant lift, speed & overall dimension Department of Aerodynamics SUPAERO Monoplane vs. biplane wing drag = Parasite Drag + Induced Drag Parasite drag is a function of Skin-Friction which depends on Wing Chord Induced Drag is very strongly effected by Aspect Ratio P6/29
Contents • Introduction • Part 1 Optimization- (Experimental) - (Numerical) • Part 2 Biplane Combinations • Part 3 Propeller Influence • Conclusions Department of Aerodynamics SUPAERO P7/29
20 grams min. for payload Design Constraints Optimization process • Maximum overall dimension : 20 cm • Lift at 10 m/s = Weight = 80 grams • Manoeuvrability : Cost function • Minimum Drag at cruise condition Department of Aerodynamics SUPAERO P8/29
AR1, Taper 1, No Swept Strut 20cm. AR2.5, Taper0.6, Swept25° Experimental setup • Wind tunnel • Test Section 45cm x 45cm • Velocity 10 m/s • Measurement • 3-component balance • Models • 16 flat-plate wing models • Aspect ratio 1 – 4 • Taper ratio 0.2 – 1.0 • Sweep angle 0 - 50° • Reference surface/length • For comparison, every model is referenced by same area, length Department of Aerodynamics SUPAERO P9/29
Strut Model Modelis not attached to strut Strut Model’s Drag Correction Department of Aerodynamics SUPAERO P10/29
Department of Aerodynamics SUPAERO Results No. Model Name Area * * * (cm.) 0 Disc 314.2 2.8223 0.0232 0.0147 1.997 0.3578 8.32 0.127 5.052 8.56 0.055 5.871 4.6 1 A1S0T0.2 144.0 2.1647 0.0146 0.0202 0.887 0.5127 6.176 0.293 2.209 23 0.085 3.803 12.3 2 A1S0T1 200.0 2.5556 0.0219 0.0214 1.449 0.3888 5.336 0.189 3.399 14.6 0.073 4.39 8.56 3 A1S25T0.6 224.8 2.4667 0.0112 0.01 1.621 0.3857 8.926 0.164 3.953 13.5 0.058 5.532 7.56 4 A1S50T0.2 144.0 2.4114 0.0163 0.0224 1.046 0.4178 9.967 0.256 2.530 21 0.078 4.128 11.3 5 A1S50T1 130.2 2.4902 0.0183 0.0281 0.944 0.3738 7.633 0.252 2.552 21.8 0.081 3.967 12.2 6 A2,5S0T0.6 146.7 3.7786 0.02 0.0273 0.627 0.2814 3.099 - - - 0.055 6.036 6.38 7 A2,5S0T1 137.9 3.556 0.0112 0.0162 0.572 0.2966 2.43 - - - 0.054 5.899 7.44 8 A2,5S25T0.6 146.7 3.6615 0.0172 0.0234 0.619 0.3032 4.904 - - - 0.052 6.288 6.38 9 A2,5S25T1 137.9 4.0961 0.02 0.029 0.601 0.2683 4.503 - - - 0.061 5.227 6.5 10 A2,5S50T1 102.9 3.0513 0.0067 0.0131 0.535 0.319 5.766 - - - 0.071 4.552 11.5 11 A4S0T0.2 99.3 4.3273 0.0166 0.0326 0.355 0.2413 2.453 - - - 0.060 5.404 8.46 12 A4S0T1 94.1 4.5539 0.0167 0.0345 0.381 0.2455 1.497 - - - 0.074 4.386 9.83 13 A4S25T0.6 96.6 4.9468 0.0133 0.0275 0.418 0.2363 3.261 - - - 0.058 5.613 7.6 14 A4S50T0.2 84.1 3.3926 0.0124 0.0295 0.481 0.2943 5.221 - - - 0.092 3.499 14.3 15 A4S50T0.6 79.5 3.4883 0.0095 0.0239 0.442 0.3056 5.95 - - - 0.091 3.533 14.9 16 A4S50T1 76.7 3.5983 0.0141 0.0368 0.424 0.2781 5.311 - - - 0.091 3.508 15.1 Red color is a value referenced by wing’s area P11/29
Numerical method • Vortex lattice method : code TORNADO v126b [T. Melin; KTH] • Drag evaluation Parasite Drag = 1.5 of equivalent flat plate skin friction drag (Blasius Eq. + Thwaites formula) + Induced drag (TORNADO) • Various models : • aspect ratio • taper ratio • sweep angle P12/29 Department of Aerodynamics SUPAERO
Triplane Biplane Monoplane An approximate stall angle curve Results • L/D at cruise cond. increases with AR • Poor manoeuvrability of monoplane wings with AR 2 and higher • greater L/D for biplanes • Biplane AR2-3 is suitable for flight • L/D of Triplane AR4 is smaller than biplane because of high parasite drag. P13/29 Department of Aerodynamics SUPAERO
250 200 150 60 grams Mass Monoplane 80 100 Biplane Biplane 50 Monoplane 0 0 0,05 0,1 0,15 0,2 0,25 0,3 0,35 0,4 -50 Drag Biplane vs. monoplane Department of Aerodynamics SUPAERO P14/29
Contents • Introduction • Part 1 Optimization - (Experimental) - (Numerical) • Part 2 Biplane Combinations • Part 3 Propeller Influence • Conclusions Department of Aerodynamics SUPAERO P15/29
Other planforms Zimmerman Plaster Drenalyne P16/29 Department of Aerodynamics SUPAERO
Inverse ZimmermanTorres et al., Univ. Florida, 1999 Calculation Plaster wingReyes et al., SUPAERO, 2001 Department of Aerodynamics SUPAERO P17/29
Decalage angle Upper Wing Stagger Gap U Lower Wing Scale 3(S4, ENSICA) Scale 1(SUPAERO) Parameters • Gap • Stagger • Decalage angle End-plates Side View Department of Aerodynamics SUPAERO P18/29
Department of Aerodynamics SUPAERO Gap • Reduced an influence between both wings • Increase lift slope and maximum lift • Not change position of aerodynamics center • Increase drag from the structure L/D not change P19/29
Stagger • Increase lift slope and maximum lift • Aerodynamics center is between two wing • No stagger has more L/D • Local AoA of fore-wing is bigger P20/29 Department of Aerodynamics SUPAERO
Decalage Angle Done with positive stagger model • Strongly effect to stall angle and L/D • Negative decalage give highest wing performance Department of Aerodynamics SUPAERO P21/29
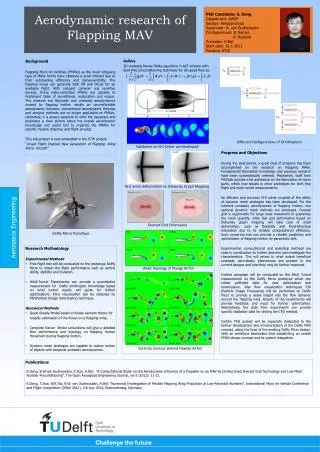
Visualisation S4, ENSICA Department of Aerodynamics SUPAERO P22/29
Contents • Introduction • Part 1 Optimization - (Experimental) - (Numerical) • Part 2 Biplane Combinations • Part 3 Propeller Influence • Conclusions Department of Aerodynamics SUPAERO P23/29
Lower wing not stalled Upper wing stalls Lift increases Lower wing stall at 22° • At pre-stall regime, lift is increased due to propeller. Tube Test section • The stall angle is delayed, lower wing is still not stall at AoA 22° Test section • 7 motor positions • were observed. Moveable system Motor & propeller Power supply Upper Wing Motor Front View Lower Wing Side View Center line Upper wing 4 5 6 7 Lower Wing 3 2 1 Half Span U Propeller Effect (S4) • Lift, maximum lift and L/D are increased. Department of Aerodynamics SUPAERO P24/29
Propeller Effect (Scale 1) • Zim2 wing planform scale 1 (20cm. Max dim.) Monoplane Wing • Motor in front of wing gives highest performance. • The motor countering / encountering wingtip vortex effects are very small. P25/29
Effect of induced flow to model 7 6 Motor sting Attach Motor to the model 5 4 L/D 3 B = mid position 2 G = lower wing 1 R = upper wing 0 5 10 15 20 -10 -5 0 25 -1 Model struts Incidence -2 Propeller Effect • Motor on upper and lower wing have the same effect • Middle position is poorest • Attached on upper and lower wing • Same efficiency • Delay stall phenomena, increase maximum lift P26/29
Contents • Introduction • Part 1 Optimization - (Experimental) - (Numerical) • Part 2 Biplane Combinations • Part 3 Propeller Influence • Conclusions Department of Aerodynamics SUPAERO P27/29
More accuracy measurement • Further optimization of motor position (wingtip) • Optimizing biplane-connecting structure • Pototype of Biplane MAV Department of Aerodynamics SUPAERO Conclusions • Biplane is better than monoplane for this design criteria • Wind tunnel measurements and numerical calculations confirm the interest for biplane MAV wings. • AR 2.5 to 3 are appropriate for biplane MAV concepts. On-going developments P28/29
Thank you for your attention P29/29
Drag Reduction of MAV by Biplane Effect Chinnapat THIPYOPAS Graduate student, Department of Aerodynamics and Jean-Marc MOSCHETTA Associate Professor of Aerodynamics, Department of Aerodynamics Ecole Nationale Supérieure de l’Aéronautique et de l’Espace (SUPAERO) 10 Av. Ed. Belin, Toulouse, France
55 Department of Aerodynamics SUPAERO Parasite and Induced Drag The zone which biplane has total drag less than monoplane configuration (when Induced drag > 45% total drag)
55 Parasite and Induced Drag Airplane drag = Parasite Drag + Induced Drag Parasite drag is a function of Skin-Friction which depends on Wing Chord Induced Drag is very strongly effected by Aspect Ratio The zone which biplane has total drag less than monoplane configuration (when Induced drag > 45% total drag)
Results • Reynolds number effect on L/D • Winglet can improve wing performance • Gap increases the lift slope and maximum lift • L/D increased by positive stagger • Stall angle and maximum lift changed by decalage angle • Parasite drag from the strut between two wing is very important
Propeller-induced lift Increasing in lift
Why are these 16 models ? • The Taguchi method was used in the first experimental design table. But an interaction between each parameters is very strong. • To determine the optimizing model, some interpolation was formed to complete the experimental table.
Scale 1 • Sweptm Plaster and Inv-Zim planeform • Connected with strut • Biplane • parameters • Gap • Stagger • Decalage angle
Visualisation Smoke generation Tuft method
Motor-Propeller Effect • Attached on upper and lower wing • Same efficiency • Delay stall phenomena, increase maximum lift