Download
1 / 1
10 likes | 160 Views
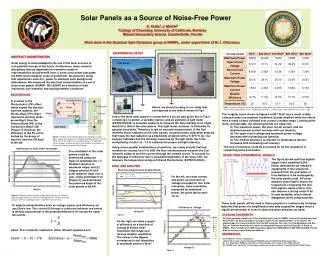
Solar Panels as a Source of Noise-Free Power. A. Dutta 1 , J. Martin 2 1 College of Chemistry, University of California, Berkeley 2 Medart Elementary School, Crawfordville, Florida Work done in the Quantum Spin Dynamics group at NHMFL, under supervision of Dr. I. Chiorescu. EXPERIMENTAL SETUP.

E N D
Solar Panels as a Source of Noise-Free Power A. Dutta1, J. Martin2 1College of Chemistry, University of California, Berkeley 2Medart Elementary School, Crawfordville, Florida Work done in the Quantum Spin Dynamics group at NHMFL, under supervision of Dr. I. Chiorescu EXPERIMENTAL SETUP ABSTRACT AND MOTIVATION Solar energy is acknowledged to be one of the main sources of non-pollutant energy of the future. Furthermore, many research disciplines that are dependent on sensitive research instrumentation would benefit from it, since solar power precludes the 60Hz (and multiples) noise of grid power. We present a study that implements solar D.C. power to eliminate such background disturbance. We measured the electrical characteristics of a set of three solar panels (SHARP: NU-U235FI) as a function of load resistance, sun intensity, and varying weather conditions. Resistor (0-24Ω) Solar Panels Circuit Breaker Ammeter BACKGROUND In contrast to the Photoelectric (PE) effect, which expels the electron from the material, the Photovoltaic (PV) effect retains the electron while promoting it from the Valence Band (VB) to the Conduction Band (CB) [Figure 1]. However, the efficiency of the PV cell is limited by the decay of electron from the CB back to the VB. Above, we show the setup of our study that corresponds to the sketch shown in Fig 1. Table : Electrical characteristics of the solar panel, detailed for four solar intensities at maximum power, compared with the *STC specifications (STC= standard test conditions, 1kW/m2, 25`C, solar spectrum of air mass 1.5)[3] Light meter The irregular curve shown in Figure 4 at 837 W/m2 was a result of data collected under inconsistent conditions (cloudy weather) while the others were a result of data collected over a more constant range. Looking at the more constant data, the following trends are observed: (1) The maximum power, the short circuit current, and the maximum power current increase with sun intensity. (2) The open circuit voltage and maximum power voltage decrease with increasing sun intensity. (3) The module efficiency (corrected for temperature effects) increases with increasing sun intensity. One of the three solar panels is connected to a circuit (see green box in Fig 1) consisting of a switch, a variable resistor, and an ammeter. A light meter (EXTECH EA33) is mounted outdoors to measure the Sun intensity at an angle identical to that of the solar panels. This light meter, however, is limited by its spectral sensitivity. Therefore, to get an accurate measurement of the Sun intensity that is radiated on the solar panels, we performed a calibration analysis that treats the Sun radiation as a blackbody emission with a T=5777 K [2]. Our analysis indicates that the intensity measured by the light meter has to be multiplied by a factor of ~7.2 to estimate the proper sunlight intensity. Figure 1. Sketch of the electrical processes ongoing in a solar panel, and of the testing circuit. Photons promote electrons from the VB to the CB; the efficiency is limited by decay. The obtained current through a known resistor is measured by an ammeter, to evaluate the electrical power and efficiency. The loss of efficiency could be accounted for by the resistance in connecting wires and diodes. Using series-parallel combinations of resistors, we create circuits that had resistances varying from 0 to 24Ω. We then simultaneously measure the Sun intensity outdoors and the current through the created circuit. To account for the decrease in efficiency due to elevated temperature of the solar cells, we measure the temperature using an Infrared thermometer (EXTECH 42540). The orientation of the solar panels could be determined using two types of optimizations: (1) Smallest variance in maximum output and (2) Largest amount of total solar radiation input over a year. Using optimization (1) [Figure 2], we determined the preferred angle of the solar panels to be 45o. NOISE- FREE EXPERIMENTAL SIGNALS The figure shows real time signals (upper inset, amplified 8,000 times) detected by the research equipments in two situations: powered from the grid (blue) or from batteries to be recharged by the solar panels (red). A Fourier analysis (main figure) shows the frequencies composing the real-time signals (same colors). One can observe a strong noise of 60 Hz and multiples, which almost disappears when using batteries. DATA AND ANALYSIS On the left, we show current and power as a function of voltage recorded for four solar intensities. Solar intensities, measured for maximum power, are given above each curve. Figure 2: Monthly variation of solar energy per m2 per day, for different panel tilt angles (from [1]). For a tilt of 45 degrees the variance of energy output is minimum, allowing research experiments all year long. These solar panels will be used in future projects to continuously recharge batteries that power the amplification and data acquisition stages since a significant decrease in noise is observed when batteries are used. To analyze characteristics such as voltage, power, and efficiency, we use Ohm’s law. The current (I) through a conductor between two points is directly proportional to the potential difference (V) across the same two points ACKNOWLEDGEMENTS Figure 3 Imax(W/m2) We thank graduate students Lei Chen and Nick Groll, and the NHMFL teams of Richard Brooks and Andy Powell, for help and support during the experimental implementation of the project. We acknowledge the financial support from the NSF programs Res. Exp. for Undergraduates and Res. Exp. for Teachers hosted by the Center for Integrating Research and Learning (Dir. P. Dixon) at NHMFL. Work funded by the NSF Cooperative Agreement DMR-0654118, NSF DMR-0645408, Florida State University and the Sloan Foundation. On the right, we show a graph of efficiency as a function of voltage at eleven solar intensities that range over various weather conditions. The values in the legend correspond to sun intensities at maximum power in W/m2. where R is conductor resistance. Other relevant equations are: REFERENCES [1] “PVWATTS: Florida- Tallahassee” <http://rredc.nrel.gov/solar/calculators/PVWATTS/version1/US/Florida/Tallahassee.html> [2] C.A. Gueymard, D.Myers, and K.Emery, Solar Energy, Vol 37, Issue 6, Dec 2002, 443-467 [3] “SHARP-solar electricity”< http://www.solarelectricsupply.com/Solar_Panels/Sharp/NU-U235F1.html> Figure 4