
Uploaded by
cynara
0 SLIDES
562 VIEWS
20LIKES
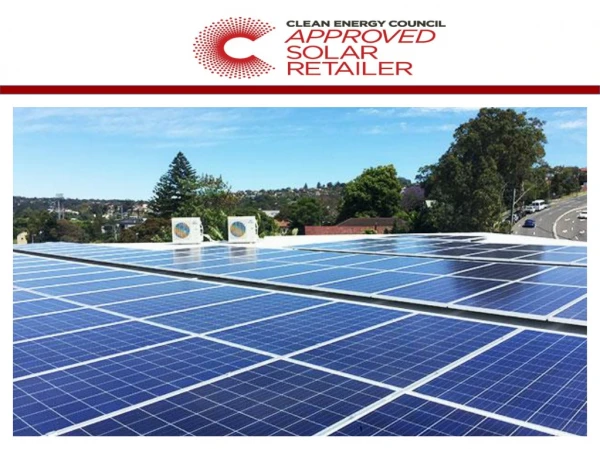
Solar Panels
DESCRIPTION
Solar Panels. JB Solar Exporting Inc., Est. 2010 BASM 530 – Research Project BASM 530 Sec 002 Barry Le-Duc & Jim Law. Solar Panels – Traditional Solar Photovoltaic Panels. Solar Panels – Thermal Applications (Water Heaters). Solar Panels – Sterling Engine Parabolic Dish Solar Panels.
Download

1 / 0
Download Presentation 
Solar Panels
An Image/Link below is provided (as is) to download presentation
Download Policy: Content on the Website is provided to you AS IS for your information and personal use and may not be sold / licensed / shared on other websites without getting consent from its author.
Content is provided to you AS IS for your information and personal use only.
Download presentation by click this link.
While downloading, if for some reason you are not able to download a presentation, the publisher may have deleted the file from their server.
During download, if you can't get a presentation, the file might be deleted by the publisher.
E N D
Presentation Transcript
- Solar Panels JB Solar Exporting Inc., Est. 2010 BASM 530 – Research Project BASM 530 Sec 002 Barry Le-Duc & Jim Law
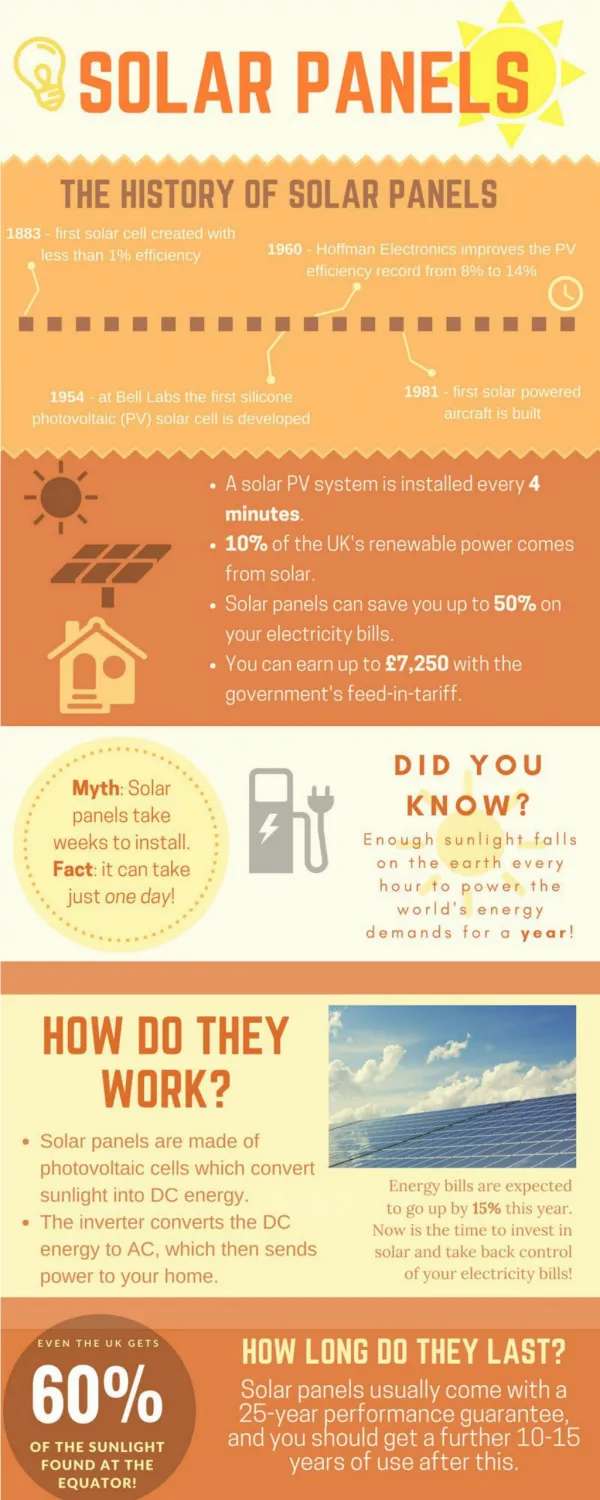
- Solar Panels – Traditional Solar Photovoltaic Panels Solar Panels – Thermal Applications (Water Heaters) Solar Panels – Sterling Engine Parabolic Dish Solar Panels Generate the world’s highest solar energy‐to‐grid electricity conversion efficiency at 31.25% 1883 - first solar cell was built by Charles Fritts production doubling every 2 years world’s fastest-growing energy technology
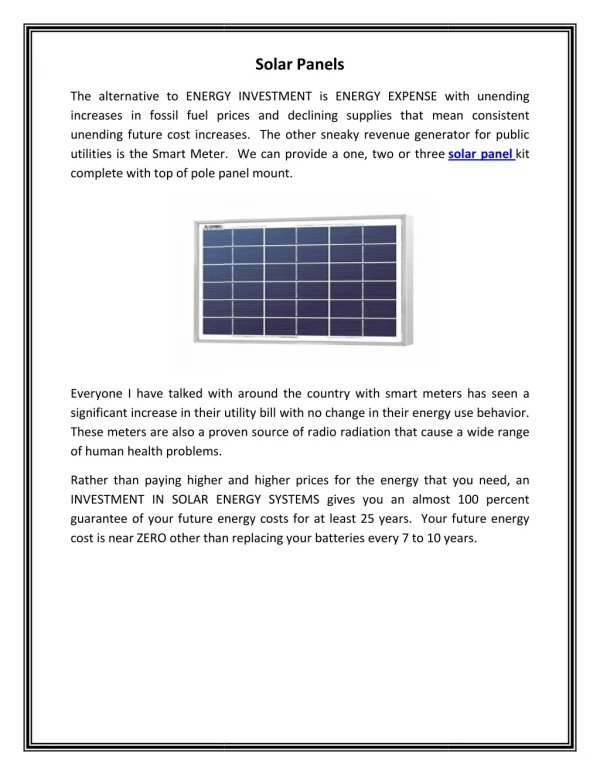
- The DM-Solar Panel 230w Features / Specs * Industry leading power tolerance : ±5W (±2.1%)* 25 years performance warranty * 96pcs of mono-crystalline solar cells* Pmax: 230W* Vmp: 47.50V* Imp: 4.84A* Voc: 58.80V* Isc: 5.25A* ETL/TUV/CE/IEC Approval* Size: 63.07"x41.77"x1.58"* Weight: 44lbs
- The United States of America Key Facts Largest and most technologically powerful economy in the world GDP (PPP) $14.25 trillion (2009 est.) Per Capita GDP of $46,900 (2009 est.) Inflation rate -0.7% (2009 est.) Sources of Comparative Advantage Physical capital: Most Universities & R&D Labs in the world Intellectual capital: Cutting edge technological knowledge Human capital: The most educated country in the world Social capital: Strong international relationships Government Incentives $100 Billion for Environment and Energy via rebates, tax credits, and loans
- Why India? 1. High Population Density 2. Very Sunny 3. Poor Electrical Infrastructure
- Republic of India Largest trading partner is US India’s tariff system - reputation of being complex and opaque Higher and greater variety of tariffs (hard for foreign companies to determine correct rates) India is lowering tariff rates and reducing variation to ASEAN levels India is a leading member of filing antidumping measures with WTO 2006 had 174 antidumping measures in place with 11 measures on US products second most populated country in the world India is the world's largest democracy comprised of 28 states and seven union territories 7th largest country in the world in terms of land mass with 32,872,631 sq. km
- Republic of India Reasons for Solar Power in India 300 days of sunshine per year daily solar incident energy over India varies from 4 to 7 kWh/m2 sunshine hours range from 2300 to 3200 per year depending on the area. India is exposed to enough solar energy to produce more than 500,000TWh/yr even with low 10% efficiency of current solar panels, India could easily meets electricity needs. much of the country especially the rural areas, are not on the electrical grid Incident Solar Energy Levels
- Government Support for Solar Power currently, solar power accounts for only 0.4% (2.12MW) Indian government introduced targets to produce 20GW of solar power by 2020 (invested $9 billion) Solar Mission under National Action Plan on Climate Change plans to increase solar generated power for both grid connected and distributed off-grid applications The Mission’s funds will be spent on research and development and incentives to utilities Indian Renewable Energy Development Agency Ltd. (IREDA) a Public Sector Company with the goal of providing loans for new and renewable sources of energy Additionally, solar powered equipment would be mandatory in all government buildings including hospitals and offices
- Solar Power Applications in India 800,000 Villages without electricity 80M people using kerosine lamps
- The Six Separations Political Separation & Standards Physical Separation Relationship & Trust Environmental Separation Developmental Separation Purchase fulfillment Business Customs / Intellectual Property Rights The Ocean Los Angeles, US to Mumbai, IN Distance: 10083 nautical miles Time: 30 days No Concerns Currency (India – Rupee / US Dollar) Language (India – English (many other) / US English) Voltage (India – 230V 50Hz / US – 110V 60Hz) Metric vs. Imperial Lower per capita GDP
- Trade costs Distribution costs Shipping costs Tariffs: None HS Code: 8541.40 “Photosensitive semiconductor devices, including photovoltaic cells whether or not assembled in modules or made up into panels; light emitting diodes “ From Los Angeles to Mumbai: $10,641.15 USD Profit sharing with local distributor and retailers Including: Fuel Surcharge, Customs Brokerage Fee, Pickup Charges, Destination Delivery Charges, & Insurance Top Five Traded Commodities: U.S.-Indian Bilateral Merchandise Trade, 2006 (U.S. $ Billions)
- Currency Exchange Indian Rupee to US Dollar Rs 45.96 : $1 (Feb. 2010) The value of the Rupee compared to the US dollar has been climbing over the past few years. This would benefit US exporters to India as it makes US products more attractive to Indian consumers
- US-INDIA Trade Relations No Bilateral Agreement (RTA) Signed Both are members of WTO and IMF US introduced Verified End User Program or trusted Customer program, facilitates the license-free sale of controlled US exports to approved Indian customers. This program will provide Indian companies the ability to obtain US technology quicker, more efficiently and in a transparent manner From 1990 to 2000 US foreign direct investment in India increased from $372 million to $2.4 billion. From 2000-2005 US FDI increased another $6 billion to $8.5 billion. This is 2200% in 15 years
- US-INDIA Trade Relations India’s Merchandise Trade with the United States 1958-2006 (USD Billions) Trade increasing between India and the US(8 times from 1986-2006 to $31.9 Billion) US trade deficit (India trade Surplus) is increasing
- US-INDIA Trade Relations U.S. Share of India’s Merchandise Trade (1958-2006) importance for US imports to India has declined 1960s US exports accounted for one third of India’s imports 2006 US supplied only 5.9% of India’s imports US remains India’s third largest source of imports
- US-INDIATrade Relations India’s Trade with the United States and China 2000-2006
- Conclusions: Comparative Advantage Advantageous Tariffs Acceptable Trade Costs Reasonable Risks Market Demand Profitable
- Questions?


More Related
Audio
Live Player