Download
1 / 46
510 likes | 753 Views
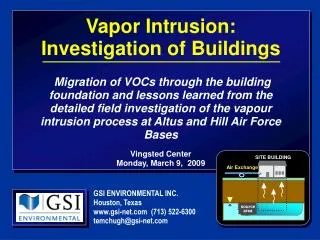
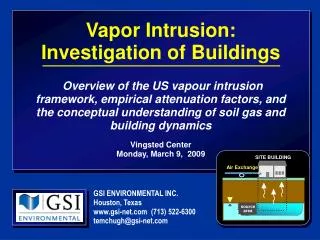
Vapor Intrusion: Investigation of Buildings. SITE BUILDING. Air Exchange. source area. Overview of the US vapour intrusion framework, empirical attenuation factors, and the conceptual understanding of soil gas and building dynamics Vingsted Center Monday, March 9, 2009.

E N D
Vapor Intrusion: Investigation of Buildings SITE BUILDING Air Exchange source area Overview of the US vapour intrusion framework, empirical attenuation factors, and the conceptual understanding of soil gas and building dynamics Vingsted Center Monday, March 9, 2009 GSI ENVIRONMENTAL INC. Houston, Texas www.gsi-net.com (713) 522-6300 temchugh@gsi-net.com
Vapor Intrusion: Wazzat? BUILDING Effect on indoor air quality? Soil source area Vapors in subsurface GW source area Vapor intrusion is the movement of volatile chemicals into buildings from below ground. KEY POINT:
Gas Summa Canister Introduction Limitations of VOC Measurements LIMITATION DETAILS High spatial and temporal variability:- Conservative assumptions OR- Large number of samples High Variability Difficulty separating vapor intrusion from indoor sources of VOCs:- Affects indoor and sub-slab samples Indoor Sources Low levels of VOCs often detected in soil gas and indoor air samples: - Summa carry over contamination - Lab contamination - Unexpected minor sources False Positives KEYPOINT: VOC measurements alone often provide a confusing picture of vapor intrusion.
B B B A A A Introduction Physical Barriers to Vapor Intrusion KEY POINT: Non-VOC measurements can provide improved understanding of vapor intrusion.
Vapor Intrusion: Investigation of Buildings lUnited States Regulatory Framework lSpatial and Temporal Variability lImpact of Indoor Sources on VI Investigations lAir Flow and VOC Migration Around Buildings lControlled Investigation of Vapor Intrusion in Buildings lConclusions and Recommendations
Vapor Intrusion: Regulatory Framework lUSEPA Framework lState Regulations lPetroleum vs. Chlorinated VOCs lSite-Specific Screening lMass Flux Evaluations
Overview of USEPA VI Guidance Conceptual Model for Vapor Intrusion: Building Attenuation Due to Exchange with Ambient Air BUILDING 3 Air Exchange Advection and Diffusion Through Unsaturated Soil and Building Foundation Unsaturated Soil 2 Affected Soil Affected GW Partitioning Between Source and Soil Vapor 1 Groundwater-Bearing Unit Regulatory guidance assumes vapor migration through soils and building foundation based on conservative assumptions. KEY POINT:
Typical Vapor Intrusion Screening Process Screening Steps Field Measurements SOIL GAS/SUB-SLAB SCREENING GWSCREENING CHEMICAL CRITERIA INDOOR AIR TESTNG DISTANCE CRITERIA Current or future buildings within 10 - 30 m of edge of impact. indoor air concentrations other measurements indicate vapor intrusion impact Soil gas/sub-slab conc. > VI screening levels Chemicals could cause VI impact based on volatility and toxicity GW conc. > VI screening levels Yes Yes Yes Yes No No No No No NFA NFA NFA NFA NFA Yes KEY POINT Mitigation/Remediation Step-wise VI investigation process recommended by most VI regulatory guidance.
USEPA VI Screening Values: Key COCs Indoor Air (ug/m3) Groundwater (mg/L) Sub-slab(ug/m3) Benzene 0.31 3.1 0.005* Ethylbenzene 2.2 22 0.70* MTBE 30000 120 3000 PCE 8.1 0.005* 0.81 TCE 0.22 0.005* 0.022 Vinyl Chloride 2.8 0.002* 0.28 Lindane 0.066 0.011 0.0066 Under EPA guidance, GW impacts above MCLs usually require VI investigation (i.e., ALL corrective action sites). KEY POINT: * = Value based on MCL, risk-based number would be lower.
Vapor Intrusion: Regulatory Framework lUSEPA Framework lState Regulations lPetroleum vs. Chlorinated VOCs lSite-Specific Screening lMass Flux Evaluations
Affected GW Overview of VI Guidance State Vapor Intrusion Guidance SITE BUILDING nDraft or final guidance from NY, NJ, WI, CA, PA, MA, MI, NH, and others. Who nNJ: Screening values account for petroleum biodeg. nMA: Screening values based on indoor background. High-lights Affected Soil nNY: Screening based on sub-slab and indoor data only. nAll: Screening values vary by >100x between states. Low-lights Approach to vapor intrusion varies widely between states. State guidance evolving rapidly. KEY POINT:
Indoor Air Limits:USEPA vs. States USEPA VI Guide1 (ug/m3) Texas1 (ug/m3) Range New Jersey (ug/m3) Benzene 0.31 2* 3.1 10x Ethylbenzene 1,100 2.2 1000 500x MTBE 2* 94 1500x 3000 PCE 3* 42 45x 0.81 TCE 3* 14 640x 0.022 Vinyl Chloride 1* 2.8 10x 0.28 Lindane N/A 0.5 76x 0.0066 KEY POINT: Indoor air, soil gas, and GW screening values vary widely between states. 1) USEPA Limits based on 10-6 cancer risk, Texas limits based on 10-5 cancer risk * = Value based on TO-15 detection limit, risk-based value would be lower.
Vapor Intrusion: Regulatory Framework lUSEPA Framework lState Regulations lPetroleum vs. Chlorinated VOCs lSite-Specific Screening lMass Flux Evaluations
Subslab to Indoor Air AF Correlation Between Groundwater Concentration and Indoor Air?? Chlorinated Solvents Petroleum Hydrocarbons Indoor Air Concentration ( ug/m3) Indoor Air Concentration ( ug/m3) CORRELATION ? YES (p <0.001) CORRELATION ? NO (p = 0.11) GW Concentration (ug/L) GW Concentration (ug/L) Observable RelationshipCiavs. Cgw ? nPetroleum Hydrocarbons: No nChlorinated Solvents: Yes - Direct Cgw = COC conc. In groundwater; Cia = COC conc. In indoor air; (p = 0.11) = Probability = 11% that slope of best-fit line = 0 (I.e., no trend).
Comax CHmin AerobicBiodegradationPossible Oxygen L Co>Comin No AerobicBiodegradation Hydrocarbon Comin CHmax Co<Comin Vapor Source Zone Vapor Concentration Petroleum Biodeg. AF Petroleum Biodegradation Conceptual Model Correlation between oxygen consumption and hydrocarbon attenuation. KEY POINT: From Roggemans et al., 2001, Vadose Zone Natural Attenuation of Hydrocarbon Vapors: An Empirical Assessment of Soil Gas Vertical Profile Data, API’s Soil and Groundwater Technical Task Force Bulletin No. 15.
Unsaturated Soil Groundwater-Bearing Unit Petroleum Vapor Intrusion: Industry Experience BUILDING Preferential pathway allows vapors to enter building. Shallow NAPL directly impacts building wall or floor. 3 2 NAPL NAPL Sump draws NAPL or dissolved hydrocarbons into building. Affected GW 1 For petroleum sites, vapor intrusion is generally associated with two factors acting together - shallow sources and preferential pathways. KEY POINT:
Vapor Intrusion: Regulatory Framework lUSEPA Framework lState Regulations lPetroleum vs. Chlorinated VOCs lSite-Specific Screening lMass Flux Evaluations
Site-Specific Screening: Vadose Zone • Fine-grained soils (e.g., silt and clay) expected to inhibit vapor intrusion. • However, available field data does not show clear relationship between soil type and vapor intrusion risk.
Vapor Intrusion: Regulatory Framework lUSEPA Framework lState Regulations lPetroleum vs. Chlorinated lSite-Specific Screening lMass Flux Evaluations
Fgw2 GW-Bearing Unit Groundwater Screening Mass Flux Evaluations SITE BUILDING MASS BALANCEAPPROACH: Fia2 ER h Mass flux into building must be < vertical mass flux out of groundwater. Fia1 Mass Balance Unsaturated Soil Fsv = Fgw1 - Fgw2 Fsv = Fia1 = Fia2 L Fsv Fgw1 source area V Key Point: High variability in subsurface VOC concentrations may limit use of mass flux analysis for vapor intrusion evaluation.
Vapor Intrusion: Investigation of Buildings lUnited States Regulatory Framework lSpatial and Temporal Variability lImpact of Indoor Sources on VI Investigations lAir Flow and VOC Migration Around Buildings lControlled Investigation of Vapor Intrusion in Buildings lConclusions and Recommendations
Study Approach: 6 7 3 2 5 8 1 4 1 High density of data collected around individual buildings at two study sites. Distribution of VOCs Vertical GW profile Vertical soil gas profile Sub-slab data Indoor air data Ambient air data Other Site Data Physical soil properties Indoor air exchange Radon analysis Cross-foundation pressure gradient 1 2 3 4 5 6 7 8 9 9 Project Overview
Sample Point Locations Altus AFB Study Site: Overview Cluster 3 Cluster 2 Cluster 1
Sample Point Locations Altus AFB Study Site: Overview Cluster 3 Cluster 2 Cluster 1 Collect at least three samples from each medium to quantify spatial variability. KEY POINT:
Altus AFB Demonstration: Field Program Field Investigation Vertical soil gas points Sample point cluster Pressure transducer Sub-slab point
Variability in Vapor Intrusion • Overview of VI Research Project • Building-Scale Spatial Variability • Short and Long-Term Temporal Variability • Impact of Variability on Attenuation Factors • Conclusions and Recommendations
Building-Scale Spatial Variability in VOC Conc. Number of Data Sets Average Variability* Ambient Air Ambient Air 6 0.55 Indoor Air Indoor Air 8 0.26 12 0.96 Sub-slab Sub-slab Deeper soil gas Deeper soil gas 7 0.96 Well Headspace Well Headspace 13 0.92 10 0.90 Ground-water Groundwater: Altus AFB Hill AFB 6 1.35 4 0.21 * = Variability expressed as average of the coefficient of variation for each data set of three samples from the medium during each sampling event Spatial variability in subsurface media much higher than in indoor or ambient air. KEY POINT:
Variability in Vapor Intrusion • Overview of VI Research Project • Building-Scale Spatial Variability • Short and Long-Term Temporal Variability • Impact of Variability on Attenuation Factors • Conclusions and Recommendations
Short-term (3 weeks) Temporal Variability in Soil Gas TCE Concentration (from Blayne Hartmen):<2x variation
Short-Term Temporal Variability:Timescale of days - Altus AFB # of Paired Samples Relative Percent Difference* < 30% 30 - 100% >100% Ambient Air Ambient Air N/A 0 N/A N/A Indoor Air Indoor Air 0 1 1 0 6 6 0 0 Sub-slab Sub-slab Deeper soil gas Deeper soil gas 7 11 4 0 Well Headspace Well Headspace 1 6 3 2 Ground-water 6 7 1 0 Groundwater * = Relative percent difference (RPD) = (Sample 1 - Sample 2)/(Average of Sample 1 and Sample 2). 61% of paired subsurface gas samples had RPD <30%. 9% had RPD >100% (3x difference). KEY POINT:
Long-Term (8 Years)Temporal Variability in Indoor VOC Concentration (from EnviroGroup):5x Variation
Long-Term (1 Year)Temporal Variability in Deep Soil Gas VOC Concentration (from NYDEQ): 5x Variation
Longer-Term Temporal Variability:Timescale of months - Altus AFB Number of Data Sets Average Variability* Ambient Air Ambient Air 0 N/A Indoor Air Indoor Air 0 N/A 6 1.02 Sub-slab Sub-slab Deeper soil gas Deeper soil gas 10 0.80 Well Headspace Well Headspace 5 0.96 Ground-water 6 0.52 Groundwater * = Variability expressed as average of the coefficient of variation for each data set of three samples from the medium during each sampling event For subsurface gas samples, longer-term temporal variability is similar to spatial variability KEY POINT:
Variability in Vapor Intrusion • Overview of VI Research Project • Building-Scale Spatial Variability • Short and Long-Term Temporal Variability • Impact of Variability on Attenuation Factors • Conclusions and Recommendations
Building-Scale Spatial Variability: How Many Samples? Number of Samples to Estimate True VOC Conc.* +/- 50% +/- 67% Ambient Air Ambient Air 3 2 Indoor Air Indoor Air 1 1 10 6 Sub-slab Sub-slab Deeper soil gas Deeper soil gas 10 6 Well Headspace Well Headspace 9 5 9 5 Ground-water Groundwater: Altus AFB Hill AFB 20 11 1 1 * = Number of samples = [(Z-statistic*CV)/Error]2; CV = coefficient of variation; for 90% confidence level, Z-statistic = 1.64 Lots of sample locations required to understand VOC concentration in subsurface. KEY POINT:
Long-Term Temporal Variability: How Many Samples? Number of Samples to Estimate True VOC Conc.* +/- 50% +/- 67% Ambient Air Ambient Air NC NC Indoor Air Indoor Air NC NC 11 6 Sub-slab Sub-slab Deeper soil gas Deeper soil gas 7 4 Well Headspace Well Headspace 10 6 Ground-water Groundwater: 3 2 * = Number of samples = [(Z-statistic*CV)/Error]2; CV = coefficient of variation; for 90% confidence level, Z-statistic = 1.64 Sampling effort should be balanced to characterized both spatial and temporal variability. KEY POINT:
Csubsurface Impact of Building-Scale Variability: Subsurface Measurements Error Between Single Measurement and Average VOC Concentration Key Point: Single measurement may not accurately represent subsurface vapor conditions. Probability Error for Single Measurement
Summary of Findings Variability in VOC Concentration: Spatial: Low Temporal: Moderate 1) Indoor Air: Spatial: High Short-Term Temporal: Low Long-Term Temporal: High 2) Subsurface: Sampling effort should be balanced to characterized both spatial and long-term temporal variability in the subsurface. KEY POINT:
Vapor Intrusion: Investigation of Buildings l United States Regulatory Framework lSpatial and Temporal Variability Impact of Indoor Sources on VI Investigations lAir Flow and VOC Migration Around Buildings lControlled Investigation of Vapor Intrusion in Buildings lConclusions and Recommendations
Significance of Background Effects Source of Background Indoor Air Impacts Key Sources of VOCs in Indoor Air nAmbient air nVehicles, gasoline nPaints, adhesives nCleaning agents nInsecticides nTobacco smoke nCosmetics, etc. REFERENCES: nUSEPA, 1991, “Building Air Quality Guide” nOSHA, 1999, “Tech Manual for Indoor Air Investigation”
Average Indoor Air Quality Over Time BENZENE TRICHLOROETHENE Average Background Concentration (ug/m3) Average Background Concentration (ug/m3) USEPA INDOOR AIR LIMIT USEPA INDOOR AIR LIMIT Indoor use of chemicals has decreased. However, average background concentration remains well above USEPA risk limits. KEY POINT: Note: 1) Average background indoor air concentrations reported in various studies by year of publication. 2) Indoor air limits (10-6) from USEPA Draft Vapor Intrusion Guidance, November 2002.
Indoor Air Consumer Products Containing PCE PCE Concentration Product ARAMCO Art and Crafts Goop Not Specified Aleenes Patio & Garden Adhesive 70% Gumout Brake Cleaner 50 - 90% Liquid Wrench Lubricant w/ Teflon 65 - 80% Plumbers Goop Adhesive 67.5% Hagerty Silversmith Spray Polish 30.5% Champion Spot it Gone 20 - 25% Wide variety of consumer products still contain high concentrations of PCE. KEY POINT: Source: http://householdproducts.nlm.nih.gov/cgi-bin/household/brands?tbl=chem&id=177
2004 Background vs. USEPA Risk-Based Limits Bkgrnd Air Clean GW BENZENE PCE Indoor 1 Range ofReported Background Concentration (ug/m3) Indoor 1 90th % Ambient 1 90th % 90th % Ambient 1 Median 90th % Median Median 10th % Median 10th % 10th % 10th % INDOOR LIMIT2 INDOOR AIR LIMIT2 In 2004, background indoor and outdoor air concentrations still exceed risk-based limits for indoor air. KEY POINT: 1) Background concentrations from Sexton et al. 2004 ES&T 38(2); 423-430. 2) USEPA Master Screening Values Table, September 2008
New Indoor Source of 1,2-DCA DETECTION FREQUENCY CONCENTRATION Median 1,2-DCA Conc. 90%ile 1,2-DCA Conc. 1,2-DCA Detection Frequency (%) 1,2-DCA Concentration (ug/m3) USEPA INDOOR AIR LIMIT <0.08 <0.08 <0.08 Indoor concentration of 1,2-DCA increasing over time. New indoor source = molded plastic (e.g., toys, Christmas decorations). KEY POINT: 2) Indoor 1,2-DCA data from residential area in Colorado. Data provided by Jeff Kurtz, Envirogroup (jkurtz@envirogroup.com) Note: 1) 1,2-DCA = 1,2-dichloroethane
Subslab Vent 100 10 1 0.1 0.01 Significance of Background Effects TCE Background at Redfields, CO., Site Pre-Remedy Post Remedy USEPA 1,1-DCE Limit KEY FINDINGS Indoor Air Data 1,1-DCE Cia in Single Home (ug/m3) nTCE does NOT change after vent system startup. n Indoor TCE NOT due to vapor intrusion. TCE TCE 1,1-DCE USEPA TCE Limit - 100 0 100 200 300 400 500 Time After Vent System Installation (Days) Adapted from USEPA Seminar on Indoor Air Vapor Intrusion, January 2003, Dallas, Texas
Significance of Background Effects Key Findings Re: USEPA VI Guidance nUSEPA indoor air limits are < < typical background VOC conc’s in indoor air. Risk-Based Air Limits n USEPA VI Screening Values are not accurate for the prediction of indoor air impacts. Use of screening values will result in a high false positive rate. False Positives Accurate identification of vapor intrusion impacts requires careful accounting of indoor sources. BOTTOM LINE: VOC = Volatile organic compound