Download
1 / 32
320 likes | 441 Views
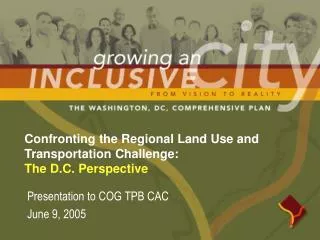
Confronting the Regional Land Use and Transportation Challenge: The D.C. Perspective. Presentation to COG TPB CAC June 9, 2005. Overview. DC’s changing role in the region Where we are today Where we are headed Why the COG forecasts concern the District Other approaches and ideas

E N D
Confronting the Regional Land Use and Transportation Challenge:The D.C. Perspective Presentation to COG TPB CAC June 9, 2005
Overview • DC’s changing role in the region • Where we are today • Where we are headed • Why the COG forecasts concern the District • Other approaches and ideas • The Comp Plan as a vehicle for guiding change
50 Years of Regional Expansion Population Share 1950 2000
50 Years of Regional Expansion Employment Share 1950 2000
Dynamics of Population Change 802,178 572,059
DC has the same number of households today as it had in 1960, but with 200,000 fewer residents 2.72 2.16 Household Size Households • Household size has declined consistently since 1960 • Between 1980 and 2000, number of households dropped by 4,800 but number of residents dropped by 66,000 • Small households in, large households out • Today, 44% of all DC households are single people
Change has Been Uneven Population Change, 1980-2000 Clusters that lost population Clusters that lost > 15 percent of their residents
Change has Been Uneven By 2000, poverty became more concentrated in DC than it was in 1990---counter to national trends. Change in concentrated poverty rate, 1990-2000
income employment education Change has Been Uneven
Creating Successful Neighborhoods • Increasing Access to Education and Employment • Connecting the City Growing More Inclusively
The Transportation Benefits of a Strong Center • 37% of DC households don’t own a car • 38% use public transit to get to work (2nd in nation, after NYC) • 12% walk to work (2nd in nation, after Boston) • Average journey to work is 29.7 minutes • 70% of those traveling to Metro walk to the station; 15% use the bus • Urban land use pattern is efficient from a transportation perspective
Facing the Future: Why DC Must Grow • Fiscal Imbalance: • 53 percent of the city’s land area is non-taxable • 2/3 of the income earned in the city is exempt from local income taxes • Regional environmental benefits associated with maintaining a strong center • Growth provides critical mass for additional retail and other services • Unmet housing needs and affordability issues • But… • Emphasis is on retaining existing residents • Attract/retain families as well as singles/couples • Don’t compromise neighborhood character or overburden infrastructure
Facing the Future: DC’s Forecasts (in thousands)
Trouble with the Regional Forecasts • Inner ring counties approach housing “buildout” around 2020 but keep adding jobs through 2030 • Overall, jobs grow at 3 times the rate of households between 2020-2030 • Examples: • Fairfax County projects an additional 72,000 jobs during the 2020s, but only 2,800 more households. • Montgomery County projects 55,000 more jobs during the 2020s, but only 15,000 more households. • Prince Georges County projects 88,000 more jobs during this period, and only 23,000 households.
Trouble with the Regional Forecasts • Shortfall of as many as 487,000 housing units projected by COG is unacceptable to the District. Would result in: • Traffic congestion • Urban sprawl and open space loss • Environmental impacts, especially air/water quality • Affordable housing • Central City decline Forecasts provide an opportunity for a regional dialogue on key issues
Other Approaches and Ideas • DC is relatively small and reached buildout in 1950, yet we have identified the capacity for 60,000 new units • For five decades, all growth has occurred through infill and redevelopment • This is about the same number of units to be added by PG County (485 Sq Mi), Montgomery County (496 Sq Mi), or Fairfax County (396 Sq Mi) between 2005-2030 • How can built out jurisdictions accommodate more households?
Home Again • Restores vacant and abandoned units • # of vacant and abandoned units in DC has declined from 6,500 in 1999 to 1,650 today
New Neighborhoods • Ten “underdeveloped” sites with the capacity for 16,000 new units • Hope VI replaces public housing with mixed income
New Communities • Targets crime “hot spots” and at-risk public housing • Provides 1:1 replacement of subsidized housing units, while adding market rate units • Creates mixed income neighborhoods • Five pilot sites identified, with potential to expand • Total 3,000-5,000 new units in first five years
Great Streets • Focuses development along corridors, coupled with investment in streetscape, transportation, economic incentives
The “Living” Downtown • More than 5,000 units to be added, primarily in the Mt Vernon Triangle and NY/ NOMA areas
Vacant Land by Zoning Promoting Infill About 600 acres of vacant land Potential for 11,000 additional units under current zoning
Strategic Redevelopment • At least 10,000 units of additional capacity exists on commercially zoned land with improvement value well below land value • Much of this land is around Metro stations, and along key corridors
The existing Comprehensive Plan document is 664 pages long and contains no tables, maps, or graphics Guiding Change: DC’s Comp Plan • General Provisions • 10 Citywide Elements • Ward Plans • Economic Development • Housing • Environmental Protection • Transportation • Public Facilities • Urban Design • Preservation and Historic Features • Downtown • Human Services • Land Use Did you know that…
Guiding Change: DC’s Comp Plan February 2004: More than 2,000 residents participated in eight Ward Summits November 2003: More than 3,000 participants attended Citizen Summit III
Guiding Change: DC’s Comp Plan • Collect and analyze baseline data • Resolve Plan format and structure issues • Complete Policy Audit • Formulate revised policies and actions • Revise the Land Use Map • Assess Plan impacts • Prepare Draft Plan (1/06) • Adoption (6/06) Community Input and Outreach
Guiding Change: DC’s Comp Plan • Website: www.inclusivecity.org • 28-member Citizens Task Force • Citywide public workshops (Jan 2005, Sep 2005, Jan 2006) • ANC briefings/ direct outreach to ANCs • Outreach to interest groups, citizen/civic associations • Press releases/ media liaison • Interagency Working Group • Small Group Discussions • Public hearings
Guiding Change: DC’s Comp Plan • New format, easier to read and navigate • Graphics and maps to be incorporated • New “elements” to be added (parks, arts, etc.) • Goals, policies, and actions to be more clearly defined • Accountability and implementation to be vastly improved • Emphasis on long-range planning—not operations • Three Vision “themes” to be interwoven
Ideas for Other Jurisdictions • Take stock of underutilized land • Focus on commercial and industrially zoned areas • Consider rezoning employment-generating land to housing • Public education and outreach regarding the issues at hand
Questions? Barry.Miller@dc.gov 442-7630 Jill.Diskan@dc.gov 442-8708