Download
1 / 35
350 likes | 469 Views
This document provides a comprehensive study on Minimum Ionizing Particle (MIP) responses across various energy levels (6, 10, 30, 50, 70, 100, 120, 150, 180, 210, 250 GeV). Key aspects include attenuation effects, energy resolution, and the relationship between Landau and Gaussian distributions. It also examines selection criteria for loose and tight MIP samples and their respective contributions to energy calibration. The document includes a comparison of ADC to GeV conversions, layer by layer energy resolution, and a detailed analysis of underlying physical interactions impacting measurement accuracy.

E N D
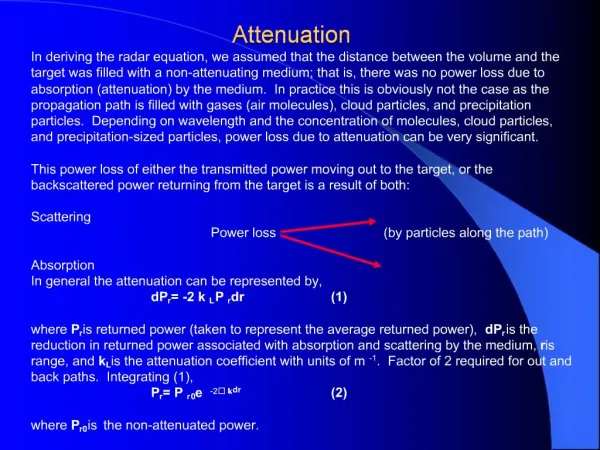
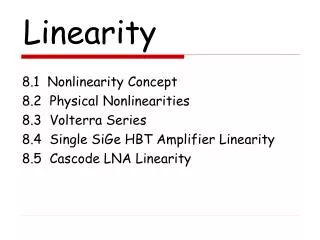
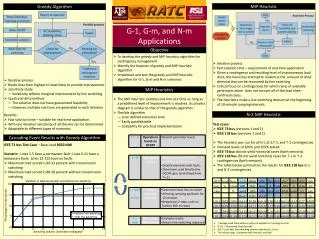
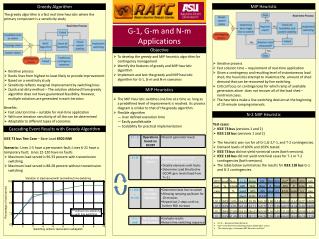
Mip • Resolution/Linearity/Long. Profile/X0 • Attenuation
MIP • Loose Selection • Etot_adc_high < 1500 • Tight Selection • Etot_adc_high < 1000 • Elayer_adc_high <100 • Special Selection Etot_adc_high
Fit • Landau Gaussian + exponential background • Mip is given by the MPV of the Landau function • Meaning of • Landau/ Gaussian Width • would like to relate one to the single channel resolution
Comparison All methods Delta = ~ 1adc Special Loose Tight Zuhao Sylvie
Energy Resolution • Lists of Runs • 6 Gev : 386,387 • 10 GeV : 427,381,453,557, • 30 GeV : 356 • 50 GeV : 392 • 70 GeV : 396 • 100 GeV : 397 • 120 GeV : 414,418,419 • 150 GeV : 401,517 • 180 GeV : 405 • 210 GeV : 395,407,408 • 250 GeV : 394,393,410 • Position (~ center of cell) • Xtab = - 2.7 mm • Ytab = + 2.7 mm
MIP from Loose Selection • Gain : • protons • 10, 30 and 150 GeV • Gaussian Fit of high_gain/low_gain Detailed studies: Stefano & Sylvie
Election Identification • Some Energy largely polluted by hadrons (6 GeV and 10 GeV) • Selection on the Shape : • E9x/E25x and E9y/E25y • Widthx and Widthy • multiplicity
Electron ID (con’t) 6GeV 30GeV
1rst Iteration of Position Correction 30 GeV Electrons Y • Approximate ADC to GeV conversion using 6 GeV (minimal leakage) • Color : Etot_mean / E_beam (i.e red ~ 1) • Idem for all 11 energies • → Average correction depending on barycenter position (10 * 10 bins) X bary ( 0 > cell center)
Leakage Correction • Approximate GeV Conversion using: • 6 GeV/Etot_adc. = 2225. • Vitaly & Loic ’s method • Ebeam/Erec = f( E_layer17/Erec) • f : 1st degree polynomial → slope, const per energy • mean slope / mean cons Example @ 30 GeV
Ebeam/Erec = f((E_lay16+E_lay17)/Erec ) • to be compared with E_lay17/Erec • Combine all Beam energies in the same plot • Fit one slope and one constant
Linearity and Resolution • No selection according to position • Same treatment @ all energies’ • NB : better if cut on xbary & ybary
S. Rosier 6 GeV
S. Rosier 70 GeV
S. Rosier 210 GeV
S. Rosier X0=1.07 lu => 17.2 X0 pour le calo
Attenuation • Mip • protons scan in X and Y • position is given by the table coordinate • all layers • Electrons Scan in X and Y • 10 GeV,30 GeV (and 150 GeV) • position is given : • Case 1 : by the table (easier) • Case 2 : by the tracker …. • central layers • Hypothesis • attenuation identical for all cells • combined fit • PM 17/18 • > Cell 34 to 37
Example of Mip Variation along X/Y Close to PM Far to PM
Example of Mip Evolution The line is to guide the eyes … mm (Table position)
Electrons (case1) PM 17 } cell 34+cell35 Beam • Idem in X and Y • 10 GeV > high gain • 30 GeV & 150 GeV > low gain • Dynode signal also used • Case where the position is given by the (relative) table position
Electrons (Case 1) Fit : Gaussian + Exponential background
Example of Distribution (case 1) Dynode Anode
Combined Fit • 3 parameters • Frac, Fast, Slow • N amplitudes • Electrons • pos < 2 cm from edges not used
Attenuation Results Δ(black-red) • Black : 10 & 30 GeV – table position • Red : idem – xytracker • Green : Mip only • Blue : Mip , 10 & 30 GeV • Yellow : idem + 150 GeV electrons
Ytracker vs Ycoo ladder 0/ zoom ladder 1 ytracker • xcoo = 9.1 xbary – 311.5 • ycoo = 9.1 ybary – 316.5 ladder 2 ycoo
Fold ycoo wrt to Table displacement • ycoo = ycoo +ΔTable • Restrict ycoo to the center of the cell (better measurement) • “same beam” • ytracker = P1*ycell + P0 • idem for the 3 ladders • mean
Final adjustement Final P1 / 648 mm P0 • We have now a Y position independent of the calorimeter
Back to Attenuation () • 10 GeV and 30 GeV electrons • E_Layer (anode/dynode) vs x-ytracker