Download
1 / 20
200 likes | 314 Views
CAWCR web portal & climate scenarios. Paul Holper, CSIRO Marine & Atmospheric Research, Australia Neil Plummer, Bureau of Meteorology, Australi a ACRE Workshop, Zurich, June 2008. Outline. Australia’s climate New climate change projections for Australia

E N D
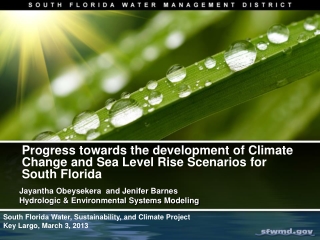
CAWCR web portal & climate scenarios Paul Holper, CSIRO Marine & Atmospheric Research, AustraliaNeil Plummer, Bureau of Meteorology, Australia ACRE Workshop, Zurich, June 2008
Outline Australia’s climate New climate change projections for Australia Climate data processing & delivery – Climate Projections Online Climatic data requirements
CSIRO, CAWCR CSIRO + BoM = CAWCR Centre for Australian Weather and Climate Research ~250 researchers • Weather and Environment Prediction • Atmosphere-Land Observation and Assessment • Ocean Prediction • ACCESS • Seasonal Prediction • Climate Change • Ocean Observation and Assessment
Australia: What is our climate? • Grappling with a changing climate and the impacts of a 10-year dry spell in the south-east • Past climate is no guide to that of the future ‘The future will be like living in a different country’
May 2008 rainfall deciles May 2008 was Australia’s driest May on record
Record runs of consecutive hot days Areas in red set all-time records in March 2008 for most consecutive days above 35°C 15 consecutive days at Adelaide – previous record 8 Source: Dr Blair Trewin, Bureau of Meteorology
Adelaide hot spells 4 days >35ºC = 1/year 7 days >35ºC = 1/10 years 8 days >35ºC = 1/20 years 15 days >35ºC = 1/3000 years Source: Dr Warwick Grace
Climate Change in Australia Most comprehensive projections delivered in Australia Prepared by CSIRO and Bureau of Meteorology Probabilistic State by State Climate variables: • temperature change, rainfall, relative humidity, solar radiation, sea surface temperature, wind speed, potential evapotranspiration Years: 2030, 2050, 2070 Percentiles: 10th, 50th and 90th Seasons + annual www.climatechangeinaustralia.gov.au
Growing attention to climate change • Massive, and growing, demand for climatic data • 44,000+ unique visitors to CCIA website since launch (3 Oct. 2007) ‘Global warming was … a strong vote-changer.’
Climate Projections Online Current system • Users obtain data from various sources and commission supply of projection data Solution • Climate Projections Online • ‘One stop shop’ for historical data and projections • Promises a more consistent, streamlined approach • Integrated historical and future climate information to improve understanding and to better manage climate risks The past is no longer a good guide to the future
Integration of historical climate data with projection information • Needed to produce realistic data required for many applications – model output is not sufficient • Needed because without allowing for climate change the historical record is becoming less relevant for its traditional uses • Allows climate change information delivery to build upon existing delivery mechanisms (e.g. National Climate Centre services) • Needed to put climate change in the context of natural variability. Allow for climate-change-induced drift. Many stakeholders want guidance on climate variations over the next 10 years. Some farmers are demanding this due to concerns over viability and succession of their farms. • Allows future climate change to be related to an observed baseline familiar to the user (e.g. ‘How will the 2030s compare to the 1990s?’)
Currently 2050 climate projection PDF for natural variability Sample obs rainfall 1900 2008 2100 We need PDF for natural variability and model greenhouse signal uncertainty rainfall 1900 2008 2100 Integration of historical climate data with projection information
Specific applications • Over the next 20-30 years what are the… • Likely changes to temperature regimes? • Likely changes in the nature and frequency of severe rainfall deficiencies? • The likely effect of projected climate changes on integrated measures of drought? • How are past exceptional climatic events placed in the context of the likely frequency and severity of future climatic events? • Government is reviewing ‘Drought Exceptional Circumstances’ funding as ‘exceptional’ events may become less so in future. • What is the information farmers and farm businesses need to understand their climatic situation and comment on appropriate tools to provide such information?
Website enhancements Enhanced Climate Change In Australia website Automation methods research Climate Projections Online Automated creation of datasets and information services for impact assessments e.g. time series I&A applications Increased demand met Simpler, quicker and cheaper for users More consistency across studies Integrated database & website development Enhanced historical climate database GCM data Climate Projections Online: Data provision Climate change research Climate provider activity User activity Climate modelling Knowledge of user needs Climate Change In Australia report Understanding regional climate change How to do projections general purpose use Applying projection methodology Datasets for impact assessment, e.g. times series I&A applications Historical climate data e.g. BOM, SILO GCM data
Outcomes of Climate Projections Online • Improves decision-making • access to better and more relevant information on climate change • Reduced duplication • in the construction of climate projections • reduced risk of clients using substandard information • Greater public exposure and acceptance of climate change information • Increase overall research activity • due to lowering ‘barriers for entry’ for researchers • Improved understanding of both climate variability and climate change by users • Easier for users to access climate data • Support of policy making: local, state and national
Climatic data requirements • Need to seamlessly link historical data to projections • We project lower rainfall in future, but it may actually be greater than now! • Need data rehabilitation and rescue; need to digitise paper records • No really good Australian datasets that are internally consistent • We have high-quality rainfall data (1900-), high-quality temperature data (1910-); but don’t have surface pressure, winds or other tropospheric fields. Reanalysis data will be valuable – internally consistent, baseline data.
Conclusions • Astonishing increase in interest in climate change • Australia is in the grips of climate change • Great demand in Australia for readily accessible information and tools • New climate change projections: www.climatechangeinaustralia.gov.au • Climate Projections Online proposed to integrate historical and future climate information to improve understanding and to better manage climate risks • Strong need for internally consistent, comprehensive climatic data
Contact Us Phone: 1300 363 400 or +61 3 9545 2176 Email: enquiries@csiro.au Web: www.csiro.au Thank you Paul HolperCSIRO Marine & Atmospheric Research +61 3 9239 4661paul.holper@csiro.au