Download
1 / 1
10 likes | 99 Views
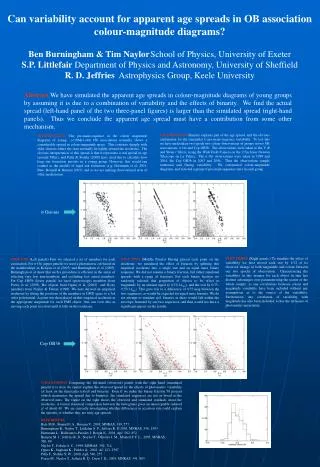
This research introduces a method for fitting color-magnitude diagrams of star clusters, considering binaries and providing robust uncertainties for parameters. The proposed technique addresses the challenge of accurately fitting models to observational data, particularly in the context of binary stars that complicate the traditional fitting methods. By utilizing a probabilistic approach and incorporating uncertainties, this method enhances the accuracy of fitting models to observed data points. The paper discusses the advantages of this new method compared to conventional techniques and demonstrates its application through the analysis of a specific star cluster, NGC2547.

E N D
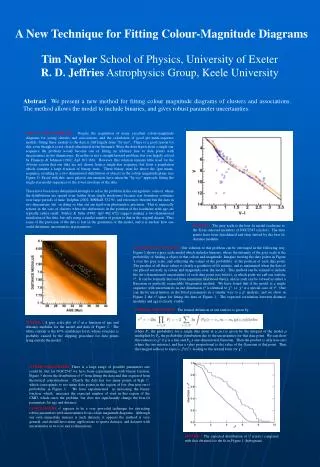
FIGURE 1 The grey scale is the best fit model isochrone to the X-ray selected members of NGC2547 (circles). The data points have been dereddened and then shifted by the best fit distance modulus. FORMAL DEFINITION The formal definition of our statistic is given by where Pi, the probability for a single data point at (ci,mi) is given by the integral of the model multiplied by PD the probability distribution due to the uncertainties for that data point. We can show this reduces to 2if is a line and PD a one-dimensional Gaussian. Then the product is only non-zero where the two intersect, and has a value proportional to the value of the Gaussian at that point. Thus the integral reduces to exp((c-ci)2/i2), leading to the normal form for 2. FIGURE 2 A grey scale plot of 2 as a function of age and distance modulus for the model and data of Figure 1. The white contour is the 67% confidence level, whose structure is probably caused by the clipping procedure for data points lying outside the model. FIGURE 3 The expected distribution of 2 (curve) compared with that obtained for the fit in Figure 1 (histogram). A New Technique for Fitting Colour-Magnitude Diagrams Tim Naylor School of Physics, University of Exeter R.D. Jeffries Astrophysics Group, Keele University Abstract We present a new method for fitting colour magnitude diagrams of clusters and associations. The method allows the model to include binaries, and gives robust parameter uncertainties. WHAT’S THE PROBLEM? Despite the acquisition of many excellent colour-magnitude diagrams for young clusters and associations, and the calculation of good pre-main-sequence models, fitting these models to the data is still largely done “by eye”. There is a good reason for this, even though it is not clearly elucidated in the literature. Were the data drawn from a single star sequence the problem would become one of fitting an arbitrary line to data points with uncertainties in two dimensions. Even this is not a straightforward problem, but was largely solved by Flannery & Johnson (1982; ApJ 263 166). However, this solution remains little used for the obvious reason that our data are not drawn from a single-star sequence, but from a population which contains a large fraction of binary stars. These binary stars lie above the (pre-)main-sequence, resulting in a two dimensional distribution of objects in the colour magnitude plane (see Figure 1). Faced with this, most galactic astronomers have taken the “by eye” approach, fitting the single-star model sequences to the lower envelope of the data. There have been more determined attempts to solve the problem in the extragalactic context, where the distributions are spread even further from single isochrones because star formation continues over large periods of time. Dolphin (2002, MNRAS 332 91, and references therein) bin the data in two dimensions, but in doing so blur out our hard-won photometric precision. This is especially serious in the case of clusters where the differences in the position of the isochrone with age are typically rather small. Tolstoy & Saha (1996; ApJ 462 672) suggest making a two-dimensional simulation of the data, but only using a similar number of points to that in the original dataset. Thus some of the precision of the data is lost in the graininess of the model, and it is unclear how one could determine uncertainties in parameters. AN INTUITIVE SOLUTIONOur solution to this problem can be envisaged in the following way. Figure 1 shows a grey scale model which includes binaries, where the intensity of the grey scale is the probability of finding a object at that colour and magnitude. Imagine moving the data points in Figure 1 over the grey scale, and collecting the values of the probability at the position of each data point. The product of all these values is clearly a goodness-of-fit statistic, and is maximised when the data of are placed correctly in colour and magnitude over the model. This method can be refined to include the (two dimensional) uncertainties of each data point (see below), at which point we call our statistic 2. It can be formally derived from maximum likelihood theory, and as such can be viewed as either a Bayesian or perfectly respectable Frequentist method. We have found that if the model is a single sequence with uncertainties in one dimension 2 is identical to 2, i.e. 2 is a special case of 2. One can derive uncertainties in the fitted parameters in a similar way to a 2 analysis, and we show in Figure 2 the 2 space for fitting the data of Figure 1. The expected correlation between distance modulus and age is clearly visible. OTHER PARAMETERS There is a large range of possible parameters one could fit, but for NGC2547 we have been experimenting with binary fraction. Figure 3 shows the distribution of 2 from fitting the data and that expected from theoretical considerations. Clearly the data has too many points at high 2, which corresponds to too many data points in the region of low (but non-zero) probability in Figure 1. We have experimented in increasing the binary fraction, which increases the expected number of stars in this region of the CMD, which cures the problem, but does not significantly change the best-fit parameters for age and distance. CONCLUSIONS 2 appears to be a very powerful technique for extracting robust parameters with uncertainties from colour magnitude diagrams. Although our own immediate interest is such datasets, it appears the method is very general, and should have many applications to sparse datasets, and datasets with uncertainties in two (or more) dimensions.