Download
1 / 31
310 likes | 373 Views
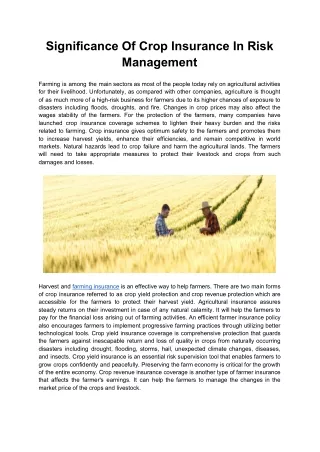
Stay informed on U.S. corn and soybean supply, world production data, market trends, and risk management strategies at the WinField regional conference. Learn about crop margins, farm bill programs, insurance coverage levels, and more. For detailed analysis and expert guidance, contact Chad Hart, Associate Professor and Crop Markets Specialist.

E N D
Crop Production Economic Risk Management WinField Regional Conference Ames, Iowa Feb. 24, 2015 Chad Hart Associate Professor/Crop Markets Specialist chart@iastate.edu 515-294-9911
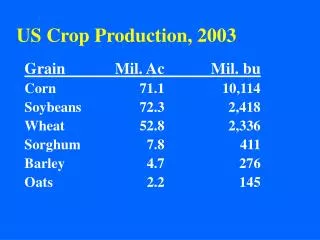
U.S. Corn Supply and Use Source: USDA-WAOB
U.S. Soybean Supply and Use Source: USDA-WAOB
Corn Yields Top: 2014 Yield Bottom: Change from last year Units: Bu/acre Source: USDA-NASS
Soybean Yields Top: 2014 Yield Bottom: Change from last month Units: Bu/acre Source: USDA-NASS
World Corn Production Source: USDA-WAOB
World Soybean Production Source: USDA-WAOB
U.S. Meat Production & Prices Source: USDA-WAOB
Corn Export Shifts Source: USDA-FAS
Soybean Export Shifts Source: USDA-FAS
Crude Oil Prices Sources: EIA and CME
Strength of the U.S. Dollar Source: Federal Reserve
Current Corn Futures 3.98 3.72 Source: CME Group, 2/20/2015
Current Soybean Futures 10.04 9.47 Source: CME Group, 2/20/2015
Thoughts for 2015 and Beyond • Supply/demand concerns • Record corn and soybean crops, but also record demand • Markets are in a holding pattern, waiting for news • Watching South American crop progress • Projected negative margins for 2014 and 2015 crops
Corn Prices vs. Costs Per Bushel Cost calculated as Per Acre Cost from ISU Extension divided by Actual Yield per Acre Sources: USDA-NASS for Prices, Duffy for Costs
Soybean Prices vs. Costs Per Bushel Cost calculated as Per Acre Cost from ISU Extension divided by Actual Yield per Acre Sources: USDA-NASS for Prices, Duffy for Costs
Farm Bill: Old vs. New Direct Payments (DP) Countercyclical Payments (CCP) Marketing Loans (LDP) Revenue Countercyclical Payments (ACRE) • Countercyclical Payments (PLC) • Marketing Loans (LDP) • Revenue Countercyclical Payments (ARC) New programs, but they have strong similarities to previous programs
PLC: Corn Payment Potential Reference Price = $3.70 per bushel Payment Yield = 150 bushels per acre Notes: PLC payments are made on 85% of base acres.
ARC-CO: 2014 Corn Revenue Guarantee Benchmark Revenue = $964.37 per acre ARC Revenue Guarantee = $829.36 per acre Notes: Revenue Guarantee equals 86% of Benchmark.
ARC-CO: 2014 Potential Corn Payment ARC Revenue Guarantee = $829.36 per acre ARC Max Payment Rate = $96.44 per acre But ARC-CO is paid on 85% of base acres and 85% of $96.44 is $81.97
PLC pays, ARC does not Neither pay Both pay ARC pays, PLC does not
Iowa Corn Acres Insured in 2014 93% of all Iowa corn acres are insured
Iowa Soy Acres Insured in 2014 94% of all Iowa soybean acres are insured
Supplemental Coverage Option (SCO) SCO RP RPHPE YP
Thank you for your time!Any questions?My web site:http://www.econ.iastate.edu/~chart/Iowa Farm Outlook:http://www.econ.iastate.edu/ifo/Ag Decision Maker:http://www.extension.iastate.edu/agdm/