Download
1 / 1
40 likes | 601 Views
References. Acknowledgement. Future Work. Introduction. Data Preprocessing/Visualization.

E N D
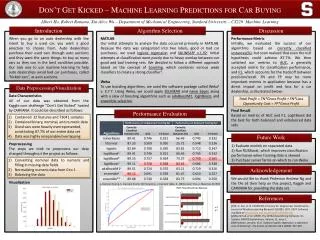
References Acknowledgement Future Work Introduction Data Preprocessing/Visualization When you go to an auto dealership with the intent to buy a used car, you want a good selection to choose from. Auto dealerships purchase their used cars through auto auctions and they want the same things: to buy as many cars as they can in the best condition possible. Our task was to use machine learning to help auto dealerships avoid bad car purchases, called “kicked cars”, at auto auctions. Data Characteristics All of our data was obtained from the Kaggle.com challenge “Don’t Get Kicked” hosted by CARVANA. It could be described as follows: Preprocessing The steps we took to preprocess our data changed throughout the project as follows: Visualization [1] R.-E. Fan, et al. LIBLINEAR: A Library for Large Linear Classification, Journal of Machine Learning Research 9(2008), 1871-1874. Software available at http://www.csie.ntu.edu.tw/~cjlin/liblinear [2] Mark Hall, et al. (2009); The WEKA Data Mining Software: An Update; SIGKDD Explorations, Volume 11, Issue 1. [3]Friedman, Jerome, et al."Additivelogistic regression: a statistical view of boosting”.The annals of statistics 28.2 (2000): 337-407. We would like to thank Professor Andrew Ng and the TAs all their help on this project, Kaggle and CARVANA for providing the data set. 1) Evaluate models on separated data 2) Run RUSBoost, which improves classification performance when training data is skewed 3) Purchase server farms on which to run Weka Algorithm Selection Discussion MATLAB Our initial attempts to analyze the data occurred primarily in MATLAB. Because the data was categorized into two labels, good or bad car purchases, we used logistic regression and libLINEAR1 v.1.92. Initial attempts at classification went poorly due to heavy overlap between our good and bad training sets. We decided to follow a different approach based on the concept of boosting, which combines various weak classifiers to create a strong classifier3. Weka To use boosting algorithms, we used the software package called Weka2 v. 3.7.7. Using Weka, we could apply libLINEAR and naïve bayes along with a slew of boosting algorithms such as adaBoostM1, logitBoost, and ensemble selection. Performance Metric Initially, we evaluated the success of our algorithms based on correctly classified instances(%), but soon realized that even the null hypothesis could achieve 87.7%. We then switched our metrics to AUC, a generally accepted metric for classification performance, and F1, which accounts for the tradeoff between precision/recall. FN and FP may be more important metrics in application because has a direct impact on profit and loss for a car dealership, as illustrated below: Final Result Based on metrics of AUC and F1, LogitBoost did the best for both balanced and unbalanced data sets. Don’t Get Kicked – Machine Learning Predictions for Car Buying Performance Evaluation Total Profit = TN*Gross Profit + FN*Loss Opportunity Cost = FP*Gross Profit Contained 32 features and 73041 samples Contained binary, nominal, and numeric data Good cars were heavily overrepresented, constituting 87.7% of our entire data set Data was highly inseparable/overlapping Albert Ho, Robert Romano, Xin Alice Wu – Department of Mechanical Engineering, Stanford University – CS229: Machine Learning Converting nominal data to numeric and filling in missing data fields Normalizing numeric data from 0 to 1 Balancing the data a. Decision Stump, b. Decision Stump 100 Iterations, c. Decision Table, d. J48 Decision Tree, e. Maximize for ROC