Download
1 / 31
310 likes | 438 Views
This document explores the complex methodologies and challenges involved in counting errors associated with Higgs particle experimentation at the Large Hadron Collider (LHC). It outlines data analysis processes originating from proton-proton collisions, employing statistical theories to handle random variables. The paper discusses the intricacies of raw data management, data cleaning, event reconstruction, and the substantial use of grid computing for data processing. Emphasizing both information conversion and knowledge extraction, it highlights the significant collaboration efforts required in particle physics research.

E N D
Physics-Informatics Looking for Higgs ParticleCounting Errors (Continued) January 28 2013 Geoffrey Fox gcf@indiana.edu http://www.infomall.org/X-InformaticsSpring2013/index.html Associate Dean for Research and Graduate Studies, School of Informatics and Computing Indiana University Bloomington 2013
Course Schedule • Introduction • Science (LHC) Counting Errors • eCommerce, matching products, movies, jobs with Recommender Systems • Large Scale Search • Cloud Computing • Health Informatics and Bio Informatics • Social Networking; graph analysis • Sensors • 1-2 weeks each
Random Variables • The area of probability and statistics underlies the analysis of physics data and in fact historically the first large analyses of this type were done in physics • Now there are more examples and physics is not the largest • The physics experiment observe proton-proton collisions at LHC and look at a “random” subset of possible results. The “theory” (which cannot be calculated) gives a probability that each final state occurs. • The experimental results are sets of collisions (called events) which form a random variable represented by a collection of individual measurements • Events – isolated independent activities are very important e.g. earthquakes, stock and bank transactions are events • The DIKW pipeline transforms this random variable into different forms with final random variable having one component – does this event fall in bin of histogram
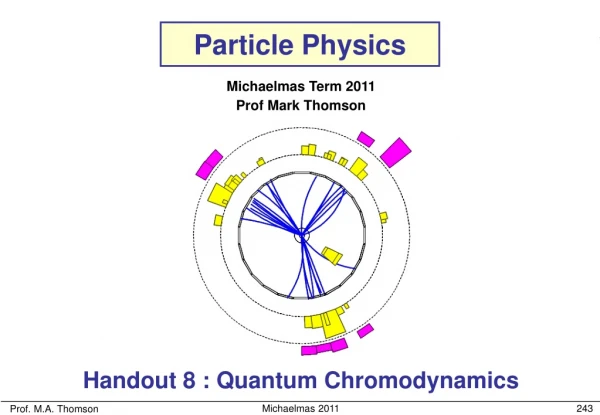
Physics DIKW Pipeline • Raw Data: Each event is “vector” of “sensor” measurements such as signals of a charged particle in an ionized chamber or an energy decomposition in a “calorimeter” or light in a “Cherenkov counter” signaling particle type or signature that particle passed through chunk of matter saying it is weakly interacting • Data or just next step: Apply clean up with calibration to get best possible measured data; event is still a vector of measurements • Information: Convert original measurements into a specification – possibly with choices and probabilities of reaction that event representsp p Reasonably stable particles “charged particles” (with energy measured by magnetic field), “neutral particles” (with energy measured in a calorimeter and a categorization (Baryon, meson, lepton, photon) • Now event is a new random variable with different types of components. Note events are of different vector length as number of particles varies from event to event. • Knowledge: Take list of particles and apply physics motivated selections to select events and calculate “aggregate properties” summed over multiple particles; histogram and scatterplot
Atlas Data Analysis • The detector generates unmanageably large amounts of raw data: about 25 megabytes per event (raw; zero suppression reduces this to 1.6 MB), multiplied by 40 million beam crossings per second in the center of the detector. This produces a total of 1 petabyte of raw data per second. • The trigger system uses simple information to identify, in real time, the most interesting events to retain for detailed analysis. There are three trigger levels. The first is based in electronics on the detector while the other two run primarily on a large computer cluster near the detector. The first-level trigger selects about 100,000 events per second. • Raw Data: After the third-level trigger has been applied, a few hundred events remain to be stored for further analysis. This amount of data still requires over 100 megabytes of disk space per second — at least a petabyte each year. • Information: Offline event reconstruction is performed on all permanently stored events, turning the pattern of signals from the detector into physics objects, such as jets (collections of particles), photons, and leptons. • Grid computing is being extensively used for event reconstruction, allowing the parallel use of university and laboratory computer networks throughout the world for the CPU-intensive task of reducing large quantities of raw data into a form suitable for physics analysis. The software for these tasks has been under development for many years, and will continue to be refined even now that the experiment is collecting data. • Knowledge: Individuals and groups within the collaboration are writing their own code to perform further analysis of these objects, searching the patterns of detected particles for particular physical models or hypothetical particles.
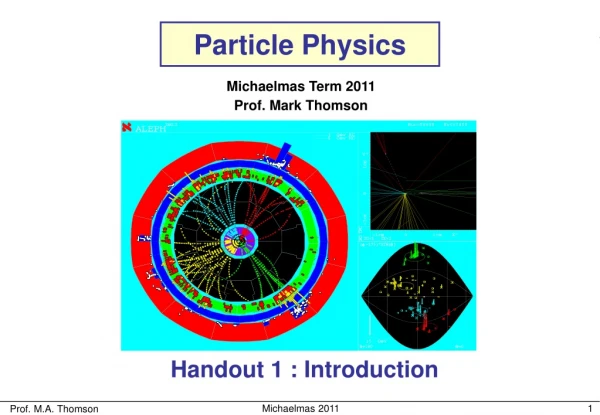
A proton-proton collision event in the CMS experiment produces two high-energy photons (the red towers). This is what physicists would expect to see from the decay of a Higgs boson, but it is also consistent with background Standard Model physics processes. Orange tracks are charged (they bend) and are mainly forward and back. The photons are sent off transversely indicative of an extreme event
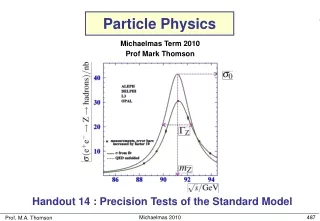
Event rate Level-1 Pedestal Effect On tape Discovery “Golden Channel” Final States at the LHC ~ 30% is diffractive
Statistics: IID • There are two simple ways of doing formal statistics of Physics analysis • Poisson Distribution • Binomial distribution • Both give the same answer for case here where the events are very very unlikely • First we note a key assumption/property • Each (physics) event is independent of previous ones • Thus events form independent identically distributed (IID) random variables • Most cases in big data either have this property or it approximately true
Statistics: Law of Large Numbers • Suppose a single valued random variable X has mean and standard deviation • is average value of X • 2 is average value of (X - )2 • Then let Xi (i= 1 .. N) be N IID random variables distributed in same way that X is • Let Observable O = i=1NXi be sum of the N Xi • Alternatively can use average of observations i=1NXi /N • Then O has expected value N and • O has standard deviation (error) √N • Note error/mean ∝ 1/√N • Note amount of “effort” ∝ N and so it takes 4 times the effort to reduce error by a factor of 2
Event/Counting Data • This basically covers all surveys as well as physics case • If you measure N responses to a question – that is similar to counting N events in a histogram – make each question a bin of histogram • Then error is √N and N is distributed with a Normal distribution which allows one to estimate chance that measurement significant • Lets look at this in Python with a survey that has 40,000 answers – each equally likely • First take case 25 is expected number of events in bin and of course √25 = 5
This Corresponds to • Asking a million people a question with 40,000 answers where each answer equally likely • Measuring a million physics events – each with one of 40,000 outcomes – each equally likely • Note bins from 22(start)-28(end) have 2789(22-23), 3060(23-24), 3132(24-25), 3179(25-26), 3111(26-27), 2793(27-28) events in them • The red curve is naïve expected number of events in each bin – Normal distribution • Good but not perfect as actual data shifted to larger values (green tends to be above red if bin start > 25, red tends to be above green if start < 25) • It predicts 3176 events in bins 24-25 and 25-26 with error √3176 = 56
Normal or Gaussian Distribution • Python: defNormal(x, mu, sigma):return exp(- (x-mu)**2/(2*sigma**2))/(sigma*sqrt(2*pi)) • See also built in scipy.stats.norm • http://en.wikipedia.org/wiki/Normal_distribution
Generating Events • Events25 = np.random.rand(1000000) • Counters25 = np.zeros(40000) • for value in Events25: Place = int(40000 * value) Counters25[Place] +=1 # Place assigns to each of one million events, a random category out of 40000
Plotting the 40,000 trials • figure("Count 25 Events 40000 times") • Numcounts25, binedges25, patches = hist(Counters25, bins = 50, range = (0,50), color = "green", alpha = 0.5) • centers25 = 0.5*(binedges25[1:] + binedges25[:-1]) • y25 = 40000 * Normal(centers25, 25, sqrt(25)) • xbar25 = np.zeros(2) • ybar25 = np.zeros(2) • xbar25[0] = 25 - sqrt(25) • xbar25[1] = 25 + sqrt(25) • ybar25 = 40000*Normal(xbar25, 25, sqrt(25)) • plot(xbar25, ybar25, color= "red", alpha = 1.0, lw =5) • plot(centers25, y25, alpha = 1.0, color = "red", lw =5)
Adding Annotations • from scipy.special import ndtri • prob1percent25 = 25 + sqrt(25) * ndtri(0.01) • prob99percent25 = 25 + sqrt(25) * ndtri(0.99) • y1percent25 = 40000*Normal(prob1percent25, 25, sqrt(25)) • y99percent25 = 40000*Normal(prob99percent25, 25, sqrt(25)) • annotate('One percent', xycoords="data", textcoords='offset points', arrowprops=dict(facecolor='black', arrowstyle="->"), xytext =(-75,50), xy = (prob1percent25, y1percent25)) • annotate('99 percent', xycoords="data", textcoords='offset points', arrowprops=dict(facecolor='black', arrowstyle="->"), xytext =(30,50), xy = (prob99percent25, y99percent25)) • annotate('One Sigma', xycoords="data", textcoords='offset points', xy = (20,ybar25[0]), xytext = (-70,30), arrowprops=dict(facecolor='black', arrowstyle="->")) • annotate('One Sigma', xycoords="data", textcoords='offset points', xy = (30,ybar25[1]), xytext = (30,30), arrowprops=dict(facecolor='black', arrowstyle="->"))
A larger set of Events • Note if you had a total of ten million events but still 40,000 categories, then the red curve is nearer the green curve and 250 is expected number of events with an error of √250 ≈ 16 • The one sigma line runs from 250- √250 to 250 + √250 • The plots get rough if reduce number of events from 40000 to 400 or 4000 • Use larger bin size (1 becomes 5) if number of events small
Making Error Bars√ Law for y axis • Numcounts25, binedges25, patches = hist(Counters25, bins = 50, range = (0,50), color = "green", alpha = 0.5) • centers25 = 0.5*(binedges25[1:] + binedges25[:-1]) • y25 = 40000 * Normal(centers25, 25, sqrt(25)) • errors25 = sqrt(y25) • errorbar(centers25, y25, yerr = errors25, linestyle='None', linewidth = 3.0, markeredgewidth = 3.0, marker ='o', color = 'black', markersize= 5.0 ) • Note the √ law governs the width of distribution (x-axis) and counts in each bin (y axis)
Making One Sigma Line√ Law for x axis • xbar25 = np.zeros(2) • ybar25 = np.zeros(2) • xbar25[0] = 25 - sqrt(25) • xbar25[1] = 25 + sqrt(25) • ybar25 = 40000*Normal(xbar25, 25, sqrt(25)) • plot(xbar25, ybar25, color= "red", alpha = 1.0, lw =5)
Meaning of a Standard Deviation (one sigma) • From Wikipedia • 68% of the time, you will be within one sigma of mean for a normal distribution
Is this stuff Right? • There are two types of corrections to “rule of thumb” that “everything pretty large” is distributed according to Gaussian distribution and for N events, the error is √N • a) There are “mathematical” corrections as rule of thumb only correct “asymptotically” • See results for 40000 counters of 25 – the observed counts are larger than prediction of Gaussian when you are in tail above mean • Easy to correct as exact distributions known. Not very important • b) Biases. If you counted results of a survey on Indiana politics based on people in Bloomington, this is not representative of state and your results will be biased (i.e. wrong)
Looks different Numpy gives “new random numbers” each time unless fix seed
Increase bin size if too few events √50 ≈ 7