Download
1 / 16
180 likes | 349 Views
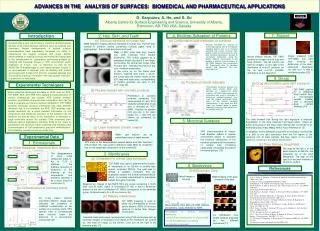
Multispecies Virtual Population Analysis Summary of Model, Applications, and Advances Lance Garrison, Jim Ianelli, Megan Tyrrell, Jason Link NEMoW Workshop 28-31 August 2007. Structure of MSVPA Model. Suitability Params. Diet Data. Consumption = Predator BM * %DR. Other Food.

E N D
Multispecies Virtual Population Analysis Summary of Model, Applications, and Advances Lance Garrison, Jim Ianelli, Megan Tyrrell, Jason Link NEMoW Workshop 28-31 August 2007
Structure of MSVPA Model Suitability Params. Diet Data Consumption = Predator BM * %DR Other Food Pprey = (Suitable Biomass)prey / Total Suitable Biomass M2age Cprey = Consumption * Pprey M2prey = Cprey / BMprey BMage BMage BMage BMage BMage Other Predators Single Species VPA
Applications of MSVPA Implementation in the “4M” Package from ICES North Sea – ICES Working Group Cod, Haddock, Whiting, Pout, Saithe, Herring, Sprat, Mackerel, Plaice, Sand lance Northeast US – Tsou & Collie Cod, Haddock, Dogfish, Hakes, Herring, Mackerel, Sand Lance, Skates, Flounder Eastern Berring Sea – Livingston & Juardo-Molina Walleye Pollock, Pacific Cod, Turbot, Yellowfin Sole, Arrowtooth Flounder, Fur Seal, Rock Sole, Pacific Herring
Model Inputs and Data Requirements Age-structured catch and biological information for all predator and prey species and associated tuning indices for VPAs Diet data including prey size/age information Consumption parameters: daily rations or temperature dependent evacuation rates Other food biomasses (and/or other predators)
Known Weaknesses in MSVPA Overparameterized - not a statistical model that fits data and provides uncertainty 4M formulation results in a Type II feeding response which leads to depensatory dynamics at low pop. Sizes Assumes constant suitability parameters and requires a comprehensive, large scale diet data set Data intensive – but then so are all Ecosystem Models
Expanded MSVPA (MSVPA-X) Developed for ASMFC to address interactions between Atlantic Menhaden and its major predators Explicitly incorporates tuned VPAs in the form of extended survivors analysis Implements a “weak” Type III feeding response Decomposes “suitability” into preference, spatial overlap, and size preference - increases the ability to assimilate data - results in dynamic suitabilities Implements a predator growth model
NEUS Application of MSVPA-X Megan Tyrrell, Jason Link
NEUS Application of MSVPA-X Five most important predators Spiny Dogfish, Winter Skate, White Hake, Northern Goosefish, Georges Bank and South Cod Megan Tyrrell, Jason Link
NEUS Application of MSVPA-X Megan Tyrrell, Jason Link
Multispecies statistical model Jim Ianelli
MSM Implementation: Eastern Bering Sea • Species: • Pollock, Pacific cod and arrowtooth flounder • Coded in C++ (ADMB) • Tuned to: • Fishery catch • Survey indices • Age (pollock) and length (arrowtooth flounder, Pacific cod) compositions Jim Ianelli
MSM system for the Bering Sea Fishery Pacific cod Walleye pollock Arrowtooth flounder
Why Use MSVPA or MSM Approaches ? These are MRM models, so suited for specific questions or trophic interactions Data rich situations with age-structured catch and biological data for a few species Both data and outputs are directly related to SS assessment models. As such, easy to compare to data and a common “language” for managers Poised for “tactical” advice