Download
1 / 33
330 likes | 414 Views
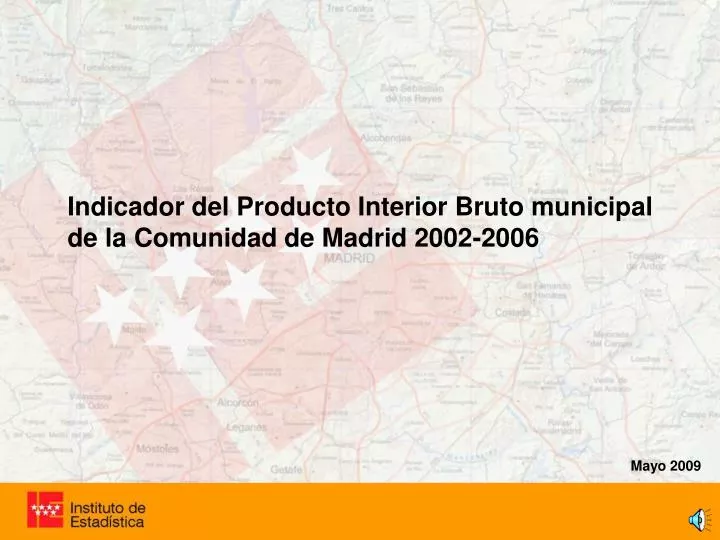
Indicador del Producto Interior Bruto municipal de la Comunidad de Madrid 2002-2006. Mayo 2009. Producto Interior Bruto municipal. 2002-2006. Millones de euros. Fuente: Indicador del Producto Interior Bruto municipal de la Comunidad de Madrid.

E N D
Indicador del Producto Interior Bruto municipal de la Comunidad de Madrid 2002-2006 Mayo 2009
Producto Interior Bruto municipal. 2002-2006 Millones de euros Fuente: Indicador del Producto Interior Bruto municipal de la Comunidad de Madrid. Instituto de Estadística de la Comunidad de Madrid
Producto Interior Bruto municipal. 2002-2006 Millones de euros Fuente: Indicador del Producto Interior Bruto municipal de la Comunidad de Madrid. Instituto de Estadística de la Comunidad de Madrid
Producto Interior Bruto municipal. 2002-2006 Millones de euros Fuente: Indicador del Producto Interior Bruto municipal de la Comunidad de Madrid. Instituto de Estadística de la Comunidad de Madrid
Producto Interior Bruto municipal. 2002-2006 Millones de euros Fuente: Indicador del Producto Interior Bruto municipal de la Comunidad de Madrid. Instituto de Estadística de la Comunidad de Madrid
Producto Interior Bruto municipal. 2002-2006 Millones de euros Fuente: Indicador del Producto Interior Bruto municipal de la Comunidad de Madrid. Instituto de Estadística de la Comunidad de Madrid
Producto Interior Bruto municipal. 2002-2006 Millones de euros Fuente: Indicador del Producto Interior Bruto municipal de la Comunidad de Madrid. Instituto de Estadística de la Comunidad de Madrid
Producto Interior Bruto municipal. 2002-2006 Millones de euros Fuente: Indicador del Producto Interior Bruto municipal de la Comunidad de Madrid. Instituto de Estadística de la Comunidad de Madrid
Producto Interior Bruto municipal. 2002-2006 Millones de euros 9% Fuente: Indicador del Producto Interior Bruto municipal de la Comunidad de Madrid. Instituto de Estadística de la Comunidad de Madrid
Producto Interior Bruto municipal. 2002-2006 Millones de euros Fuente: Indicador del Producto Interior Bruto municipal de la Comunidad de Madrid. Instituto de Estadística de la Comunidad de Madrid
Producto Interior Bruto municipal. 2002-2006 Millones de euros Fuente: Indicador del Producto Interior Bruto municipal de la Comunidad de Madrid. Instituto de Estadística de la Comunidad de Madrid
Producto Interior Bruto municipal. 2002-2006 Millones de euros Fuente: Indicador del Producto Interior Bruto municipal de la Comunidad de Madrid. Instituto de Estadística de la Comunidad de Madrid
Producto Interior Bruto municipal. 2002-2006 Millones de euros Fuente: Indicador del Producto Interior Bruto municipal de la Comunidad de Madrid. Instituto de Estadística de la Comunidad de Madrid
Producto Interior Bruto municipal. 2002-2006 Millones de euros Fuente: Indicador del Producto Interior Bruto municipal de la Comunidad de Madrid. Instituto de Estadística de la Comunidad de Madrid
Producto Interior Bruto municipal. 2002-2006 Millones de euros 39% Fuente: Indicador del Producto Interior Bruto municipal de la Comunidad de Madrid. Instituto de Estadística de la Comunidad de Madrid
Producto Interior Bruto municipal. 2006 (a) 63% Fuente: Indicador del Producto Interior Bruto municipal de la Comunidad de Madrid. Instituto de Estadística de la Comunidad de Madrid
Producto Interior Bruto municipal. 2006 (a) 63% 63% 96% Fuente: Indicador del Producto Interior Bruto municipal de la Comunidad de Madrid. Instituto de Estadística de la Comunidad de Madrid
Producto Interior Bruto per cápita por municipios. 2006 (a) Euros 30.094 € Tres Cantos 2,1 Alcobendas 2,2 Madrid 1,2 63% 63% 96% Ajalvir 2,8 Fuente: Indicador del Producto Interior Bruto municipal de la Comunidad de Madrid. Instituto de Estadística de la Comunidad de Madrid
Producto Interior Bruto per cápita por municipios Euros 2002 63% 63% 96% Fuente: Indicador del Producto Interior Bruto municipal de la Comunidad de Madrid. Instituto de Estadística de la Comunidad de Madrid
Producto Interior Bruto per cápita por municipios Euros 2003 63% 63% 96% Fuente: Indicador del Producto Interior Bruto municipal de la Comunidad de Madrid. Instituto de Estadística de la Comunidad de Madrid
Producto Interior Bruto per cápita por municipios Euros 2004 63% 63% 96% Fuente: Indicador del Producto Interior Bruto municipal de la Comunidad de Madrid. Instituto de Estadística de la Comunidad de Madrid
Producto Interior Bruto per cápita por municipios Euros 2005 (p) 63% 63% 96% Fuente: Indicador del Producto Interior Bruto municipal de la Comunidad de Madrid. Instituto de Estadística de la Comunidad de Madrid
Producto Interior Bruto per cápita por municipios Euros 2006 (a) 63% 63% 96% Fuente: Indicador del Producto Interior Bruto municipal de la Comunidad de Madrid. Instituto de Estadística de la Comunidad de Madrid
Tipología municipal según PIB per cápita sectorial 63% 63% 96% Fuente: Indicador del Producto Interior Bruto municipal de la Comunidad de Madrid. Instituto de Estadística de la Comunidad de Madrid
Tipología municipal según PIB per cápita sectorial 0,4% del PIB total 21% del PIB agrícola 63% 63% 96% Fuente: Indicador del Producto Interior Bruto municipal de la Comunidad de Madrid. Instituto de Estadística de la Comunidad de Madrid
Tipología municipal según PIB per cápita sectorial 63% 63% 96% Fuente: Indicador del Producto Interior Bruto municipal de la Comunidad de Madrid. Instituto de Estadística de la Comunidad de Madrid
Tipología municipal según PIB per cápita sectorial PIB pc medio Industrial 6.815 € PIB pc industrial del grupo 27.638 € Media regional 30.094 € Media del grupo 42.163 € 63% 63% 96% Fuente: Indicador del Producto Interior Bruto municipal de la Comunidad de Madrid. Instituto de Estadística de la Comunidad de Madrid
Tipología municipal según PIB per cápita sectorial 63% 63% 96% Fuente: Indicador del Producto Interior Bruto municipal de la Comunidad de Madrid. Instituto de Estadística de la Comunidad de Madrid
Tipología municipal según PIB per cápita sectorial Media regional 30.094 € Media del grupo 37.982 € 75% PIB sector servicios 63% 63% 96% Fuente: Indicador del Producto Interior Bruto municipal de la Comunidad de Madrid. Instituto de Estadística de la Comunidad de Madrid
Tipología municipal según PIB per cápita sectorial 63% 63% 96% Fuente: Indicador del Producto Interior Bruto municipal de la Comunidad de Madrid. Instituto de Estadística de la Comunidad de Madrid
Tipología municipal según PIB per cápita sectorial 63% 63% 96% Fuente: Indicador del Producto Interior Bruto municipal de la Comunidad de Madrid. Instituto de Estadística de la Comunidad de Madrid
Tipología municipal según PIB per cápita sectorial 25% del PIB regional 63% 63% 96% Fuente: Indicador del Producto Interior Bruto municipal de la Comunidad de Madrid. Instituto de Estadística de la Comunidad de Madrid
Esta información se puede ampliar en: · Cuadernos en red · Datos estructurales 2004 · Sistema de tabulación on-line: 2005 (p) 2006 (a)