Download
1 / 25
250 likes | 384 Views
Biogeochemical processes in seasonally snow covered systems Snow Distribution Vegetation Water Source Hydrochemistry Biosphere-Atmosphere Gas Exchange. Snow Distribution Vegetation communities are strongly linked to patterns of snow accumulation and melt by their influence on mass,

E N D
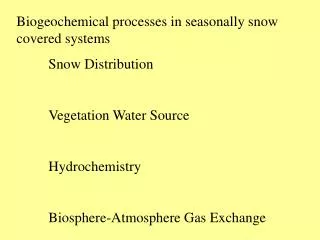
Biogeochemical processes in seasonally snow covered systems Snow Distribution Vegetation Water Source Hydrochemistry Biosphere-Atmosphere Gas Exchange
Snow Distribution Vegetation communities are strongly linked to patterns of snow accumulation and melt by their influence on mass, chemical and energy exchanges, and by their sensitivity to snow thermal insulation and spring time inputs of meltwater, nutrients and latent heat.
Snow Distribution 1) Interception
Snow Distribution – Vegetation Effects 2) Wind Redistribution
Snow Distribution – Vegetation Effects 3) Wind Redistribution/ Energy Balance
Vegetation Water Source Biomass Production Agriculture Protected Areas Parks and Wilderness Habitat
Snow Biogeochemistry; Hydrochemistry Dissolved Organic Matter Inorganic Nitrogen
160 120 DEEP Snow Depth (cm) 80 40 SHALLOW 0 0 C) o DEEP -4 Soil Temperature ( SHALLOW -8 -12 FEB MAR APR MAY JAN
Relationship between temperature and soil heterotrophic activity 600 400 CO2 Flux (mg C/m2/d) 200 0 -6 -5 -4 -3 -2 -1 0 SoilTemperature
8 Snowmelt Began 7 6 5 -2 4 microbial biomass Grams N m 3 2 1 0 0 50 100 150 Julian Day
8 Snowmelt Began 7 6 5 microbial N -2 4 Grams N m 3 2 soil inorganic N 1 0 0 50 100 150 Julian Day
1.8 1.6 1.4 1.2 1 y = -0.0106x + 1.3327 2 R = 0.9919 Nitrate Leachate (g N/m2) 0.8 0.6 0.4 0.2 0 0 20 40 60 80 100 120 Mean Daily CO2 Flux (mg C/m2)
Conceptual Model of How Snow Cover Controls Over-winter Heterotrophic Activity Absence of Snow Cover Freeze-Thaw Frozen Soil Freeze-Thaw LimitsPrimary Cell Lysis Limits Decreases Carbon Production Increases Activity Substrate Carbon Substrate Over-winter Heterotrophic Activity Snow Cover Duration
1.4 1.2 Forest Sites 1 y = -0.3725Ln(x) + 2.1949 2 R = 0.9232 0.8 Nitrate Leachate (g N/m2/yr) 0.6 Meadow Sites 0.4 y = -0.5381Ln(x) + 2.8147 2 R = 0.9171 0.2 0 0 100 200 300 400 500 CO2 Flux (mg C/m2/d)
2 1.8 1.6 1.4 1.2 N retention (kg/ha) 1 y = 0.0245x - 0.2965 2 R = 0.7627 0.8 0.6 0.4 0.2 0 40 45 50 55 60 65 70 75 80 85 Winter precip (cm)
Discharge (Montezuma) and DOC (DC5) 1980 - 1996 25 7 6 20 5 15 4 DOC (ppm) Discharge (m3/sec) 3 10 2 5 1 0 0 1984 1986 1993 1994 1995 1996 1985 1980 1981 1982 Water Year
Heterotrophic activity vs. DOC export 35 30 ) -2 25 y = 0.0637x + 4.2667 20 DOC Leachate (g C m R 2 = 0.9065 15 10 5 100.0 150.0 200.0 250.0 300.0 350.0 400.0 450.0 -2 -1 Flux (mg C m d Mean Daily CO ) 2
y = 0.3994x + 0.8987 5 2 = 0.836 R 4.5 4 3.5 3 DOC Concentration (ppm) y = 0.3697x - 0.3526 2.5 2 R = 0.6544 2 1.5 1 0.5 0 0 1 2 3 4 5 6 7 8 9 10 Discharge (m3/sec)
Vegetation communities are strongly linked to patterns of snow accumulation and melt by their influence on mass, chemical and energy exchanges, and by their sensitivity to snow thermal insulation and spring time inputs of meltwater, nutrients and latent heat. Many snow models and parameterisations presume stationary plant communities as part of their regional calibrations. It is now felt that the complex cumulative impacts of a changing environment have created a global need for focused studies of snow-vegetation interactions at several scales: plant, plant community, landscape, biome and global.
Discharge (Montezuma) and DOC (SN2) 1980 - 1996 25 7 6 20 5 15 4 Dicharge (m3/sec) DOC (ppm) 3 10 2 5 1 0 0 1993 1994 1995 1996 1986 1985 1981 1984 1982 1980 Water Year
30 y = 1.0342x - 32.142 2 R = 0.9948 25 grams) 20 6 15 DOC Export (10 y = 0.1265x - 0.4547 10 2 R = 0.7326 5 0 30 35 40 45 50 55 60 Water yield (cm)