Analyzing User Interactions for Data and User Modeling
Analyzing User Interactions for Data and User Modeling. Remco Chang Assistant Professor Tufts University. Human + Computer. Human vs. Artificial Intelligence Garry Kasparov vs. Deep Blue (1997) Computer takes a “brute force” approach without analysis


Analyzing User Interactions for Data and User Modeling
E N D
Presentation Transcript
Analyzing User Interactions forData and User Modeling Remco Chang Assistant Professor Tufts University
Human + Computer • Human vs. Artificial Intelligence Garry Kasparov vs. Deep Blue (1997) • Computer takes a “brute force” approach without analysis • “As for how many moves ahead a grandmaster sees,” Kasparov concludes: “Just one, the best one” • Artificial vs. Augmented Intelligence Hydra vs. Cyborgs (2005) • Grandmaster + 1 chess program > Hydra (equiv. of Deep Blue) • Amateur + 3 chess programs > Grandmaster + 1 chess program1 1. http://www.collisiondetection.net/mt/archives/2010/02/why_cyborgs_are.php
“The computer is incredibly fast, accurate, and stupid. Man is unbelievably slow, inaccurate, and brilliant. The marriage of the two is a force beyond calculation.” -Leo Cherne, 1977 (often attributed to Albert Einstein)
(Modified) Van Wijk’s Model of Visualization User Data Visualization Vis Perceive Image Data Discovery Interaction Params Explore
When the Analyst is Successful…. Data + Vis + Interaction + User = Discovery User Data Visualization Vis Perceive Image Data Discovery Interaction Params Explore
Remco’s Research Goal “Reverse engineer” the human cognitive black box (by analyzing user interactions) • Data Modeling • Interactive Metric Learning • User Modeling • Predict Analysis Behavior • Perception and Cognition • Perception Modeling • Cognitive Priming • Mixed Initiative Systems • Adaptive Visualization and Computation R. Chang et al., Science of Interaction, Information Visualization, 2009.
Data Modeling • Interactive Metric Learning Quantifying a User’s Knowledge about Data
1. Richard Heuer. Psychology of Intelligence Analysis, 1999. (pp 53-57)
Metric Learning • Finding the weights to a linear distance function • Instead of a user manually give the weights, can we learn them implicitly through their interactions?
Metric Learning • In a projection space (e.g., MDS), the user directly moves points on the 2D plane that don’t “look right”… • Until the expert is happy (or the visualization can not be improved further) • The system learns the weights (importance) of each of the original k dimensions • Short Video (play)
Dis-Function Optimization: Brown et al., Find Distance Function, Hide Model Inference. IEEE VAST Poster 2011 Brown et al., Dis-function: Learning Distance Functions Interactively. IEEE VAST 2012.
Results • Used the “Wine” dataset (13 dimensions, 3 clusters) • Added 10 extra dimensions, and filled them with random values • Blue: original data dimension • Red: randomly added dimensions • X-axis: dimension number • Y-axis: final weights of the distance function
User Modeling 2. Learning about a User in Real-Time Who is the user, and what is she doing?
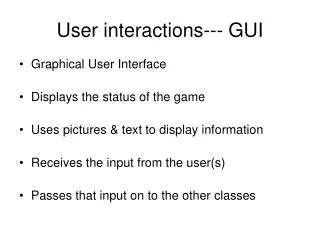
One Question at a Time Data + Vis + Interaction + User = Discovery User Data Visualization Fast or Slow? Novice or Expert? Introvert or Extrovert? Vis Perceive Image Data Discovery Interaction Params Explore
Experiment: Finding Waldo • Google-Maps style interface • Left, Right, Up, Down, Zoom In, Zoom Out, Found
Pilot Visualization – Completion Time Fast completion time Slow completion time Eli Brown et al., Where’s Waldo. IEEE VAST 2014, Conditionally Accepted.
“Real-Time” Prediction (Limited Time Observation) State-Based Linear SVM Accuracy: ~70% Interaction Sequences N-Gram + Decision Tree Accuracy: ~80%
Predicting a User’s Personality Internal Locus of Control External Locus of Control Ottley et al., How locus of control influences compatibility with visualization style. IEEE VAST , 2011. Ottley et al., Understanding visualization by understanding individual users. IEEE CG&A, 2012.
Predicting Users’ Personality Traits • Noisy data, but can detect the users’ individual traits “Extraversion”, “Neuroticism”, and “Locus of Control” at ~60% accuracy by analyzing the user’s interactions alone. Predicting user’s “Extraversion” Linear SVM Accuracy: ~60%
Perception and Cognition 3. What are the Factors that Correlate with a User’s Performance?
Individual Differences and Interaction Pattern • Existing research shows that all the following factors affect how someone uses a visualization: • Spatial Ability • Experience (novice vs. expert) • Emotional State • Personality • Cognitive Workload/Mental Demand • Perception • … and more Peck et al., ICD3: Towards a 3-Dimensional Model of Individual Cognitive Differences. BELIV 2012 Peck et al., Using fNIRS Brain Sensing To Evaluate Information Visualization Interfaces. CHI 2013
Emotion and Visual Judgment Harrison et al., Influencing Visual Judgment Through Affective Priming, CHI 2013
Priming Inferential Judgment • The personality factor, Locus of Control* (LOC), is a predictor for how a user interacts with the following visualizations: Ottley et al., How locus of control influences compatibility with visualization style. IEEE VAST , 2011.
Locus of Control vs. Visualization Type • When with list view compared to containment view, internal LOC users are: • faster (by 70%) • more accurate (by 34%) • Only for complex (inferential) tasks • The speed improvement is about 2 minutes (116 seconds)
Priming LOC - Stimulus • Borrowed from Psychology research: reduce locus of control (to make someone have a more external LOC) “We know that one of the things that influence how well you can do everyday tasks is the number of obstacles you face on a daily basis. If you are having a particularly bad day today, you may not do as well as you might on a day when everything goes as planned. Variability is a normal part of life and you might think you can’t do much about that aspect. In the space provided below, give 3 examples of times when you have felt out of control and unable to achieve something you set out to do. Each example must be at least 100 words long.”
Results: Averages Primed More Internal Performance Good External LOC Average LOC Average ->Internal Internal LOC Poor Visual Form Containment List-View Ottley et al., Manipulating and Controlling for Personality Effects on Visualization Tasks, Information Visualization, 2013
Modeling Perception and Cognition • Building cognitive models (even the simple ones) is still a work in progress • Low hanging fruits! • Direct brain imaging / measurement • Modeling perception
Cognitive Load Functional Near-Infrared Spectroscopy • fNIRS • a lightweight brain sensing technique • measures mental demand (working memory) Evan Peck et al., Using fNIRS Brain Sensing to Evaluate Information Visualization Interfaces. CHI 2013.
Weber’s Law & Just Noticeable Difference (JND) Perception Perception Perceived Stimulus Ideal Just Noticeable Difference Ideal Objective Stimulus Objective Stimulus
Perception of Correlation and Weber’s Rensink and Baldridge, The Perception of Correlation in Scatterplots. EuroVis 2010.
Ranking Visualizations Harrison et al., Ranking Visualization of Correlation with Weber’s Law. InfoVis2014 (Conditional)
Mixed Initiative (Adaptive) Systems 4. What Can a System Do If It Knows Everything About Its User?
(Human+Computer) Visual Analytics Discovery User Adaptive Visualization Visualization Intent (Model) Adaptive Computation Waldo Data (Model) Interaction Dis-Function
Adaptive Visualization • Color-Blindness, Cultural Differences, Personality, etc. • Cognitive Workload Afergan et al., Dynamic Difficulty Using Brain Metrics of Workload. CHI 2014
Adaptive Computation • A new approach for Big Data visualization • Observation: Data is so large that… • There are more data items than there are pixels • Each computation (across all data items) takes tremendous amount of time, space, and energy • Solution: User-Driven Computation • Conserve these precious resources by computing “partial” information based on User and Data Models
Example Problem: Big Data Exploration Large Data in a Data Warehouse Visualization on a Commodity Hardware
Example 1: JND + Streaming Data • Streaming visualization (Fisher et al., CHI 2012) • JND-based streaming data and visualization • Stop the computation and streaming at JND • Similar to audio (mp3), image (jpg2000), graphics (progressive meshing) • Differ in that the JND will be based on semantic information (e.g. correlation) t = 1 second t = 5 minute
Example 2: Predictive Pre-Computation and Pre-Fetching • In collaboration with MIT and Brown • Using an “ensemble” approach for prediction • Large number of prediction algorithms • Each prediction algorithm is given more computational resources based on past performance • Evaluated system with domain scientists using the NASA MODIS dataset (multi-sensory satellite imagery) • Remote analysis on commodity hardware shows (near) real-time interactive analysis
Summary • “Interaction is the analysis”1 • A user’s interactions in a visual analytics system encodes a large amount of data • Successful analysis can lead to a better understanding of the user • The future of visual analytics lies in better human-computer collaboration • That future starts by enabling the computer to better understand the user 1. R. Chang et al., Science of Interaction, Information Visualization, 2009.
Summary “Reverse engineer” the human cognitive black box (by analyzing user interactions) • Data Modeling • Interactive Metric Learning • User Modeling • Predict Analysis Behavior • Perception and Cognition • Perception Modeling • Cognitive Priming • Mixed Initiative Systems • Adaptive Visualization • Adaptive Computation