Download
1 / 16
160 likes | 234 Views
Berlin’s Air Quality Strategy : measures and expected effects. Martin Lutz Senate Department for Urban Development, Berlin Directorate IX, Environment Policy. brief recap: problems, origin, sources expected benefit of a trend scenario additional measures and their impact.

E N D
Berlin’s Air Quality Strategy: measures and expected effects Martin Lutz Senate Department for Urban Development, Berlin Directorate IX, Environment Policy • brief recap: problems, origin, sources • expected benefit of a trend scenario • additional measures and their impact
Comparison of PM10-pollution in European cities EU-limit value
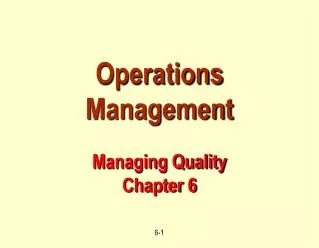
40 35 30 25 20 15 10 urban background Source analysis Simplified schematic of the PM pollution Urban areas countryside Traffic, local sources PM [µg/m³] regional background hemisspheric/natural background
source attribution Sectors contributing to total PM10 at a busy traffic spot in Berlin.... #based on values recorded at the top of a radio tower 324m above ground Institut für Energie- und Umwelttechnik e.V.
street canyon Air pollution control planning in Berlin multi-scale model calculations ~30x30 km2 4x4 km2 1x1 km2
current situation (base year 2002) modelled PM10 in street canyons 24h limit value annual limit value • 450 km road sections in non-attainment • 190.000 affected residents
trend scenario 2010 predicted PM10 concentration in main road network 24h limit value annual limit value • 200 km road sections in non-attainment • ca 81.000 affected residents
Air pollution control planning additional measures planned • stationary sources • BAT and more …. • transport: • cleanervehicles and fuels • municipal car fleet (CRT retrofit & CNG) • LEZ (low emission zone) • less traffic through sustainable transport- and city planning (master plan transport, “StEP”), inter alia…. • re-routing through traffic on tangential roads • extension of zones with parking fees • expected effect: ~ 10% traffic reduction in Berlin’s centre • Optimized traffic management at hot spots ( HEAVEN) • linked with noise abatement • Speed limits • big effect on noise and safety • little effect on air quality • stationary sources • BAT and more …. • transport: • cleanervehicles and fuels • municipal car fleet (CRT retrofit & CNG) • LEZ (low emission zone) • less traffic through sustainable transport- and city planning (master plan transport, “StEP”), inter alia…. • re-routing through traffic on tangential roads • extension of zones with parking fees • expected effect: ~ 10% traffic reduction in Berlin’s centre • Optimized traffic management at hot spots ( HEAVEN) • linked with noise abatement • Speed limits • big effect on noise and road safety • little effect on air quality
Options for LEZ: Emission reduction in relation to the trend scenario 2010 impact of transport planning („StEP“) and vehicle technology all Diesel vehicles Euro III + particle filter(PF) all vehicles Euro IV + PF busses Euro V big fleets of delivery services and logistic firms municipal fleet no StEP with StEP no StEP implementation 2010
Air Pollution Control Planning Core measure: low emision zone traffic restriction for high emitting Diesel vehicles in the cenral city area • stage I: 2008, minimum criteria EURO II • stage II: 2010, minimum criteria EURO III & particle filter scrutiny in 2006, whether retrofit with particle trap could be required already in stage I at last under preparation... • national labelling scheme for clean vehicles Federal Government • tax incentives, in particular for clean (or retrofitted) vans and lorries Federal Government
Air Pollution Control Planning impact of various control scenarios
24h limit value annual limit value low emission zone low emission zone LEZ & “StEP” scenario 2010 PM10 reduction beyond the trend scenario 2010
24h limit value Beusselstr annual limit value remaining hot spots where local traffic management is an option LEZ & “StEP” scenario 2010 predicted PM10 concentration in main road network
Expected decrease of PM10 in Berlin 40 -9% 35 -11% -13% -14% 30 -4% -13% -24% -30% 25 local increment -8% -10% -11% -15% 20 urban increment annual average PM10 [µg/m³] regional BG 15 10 -10% -10% -10% -10% 5 0 2002 CLE 2010 LEZ 2010 LEZ StEP "MFR" 2010 Results of scenario runs
Air Pollution Control Planning supplementary action Optimised traffic management at hot spots • HEAVEN: potential for improvement up to 20% (NOx) and 7% (PM10) by truck ban • limited scope for implementation • needs thorough investigation to avoid disbenefits elsewhere • successive scrutiny of remaining hot spots • Speed limits • concept for imposing 30 km/h limits on main roads where noise & road safety & air pollution warrants