Download

1 / 32
320 likes | 436 Views
This paper by Hikmet Aras explores the issue of motion artifacts in LCD displays, specifically focusing on chroma shifting caused by refresh rates and rendering inefficiencies. By examining principles of human visual perception (HVS), the study proposes post-processing techniques to reduce these artifacts. It emphasizes the importance of color spaces, such as YIQ and LAB, for separating luminance and chrominance, and details methods for detecting and correcting chroma shifting through edge detection. The paper also introduces image quality metrics that are sensitive to human visual perception for a more accurate assessment of image quality.

E N D
Motion Artifacts in LCD Displays Prepared by Hikmet Aras
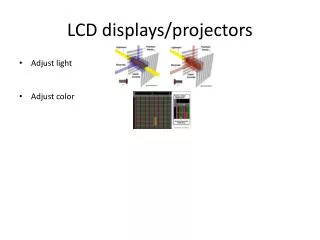
ChromaShifting The Reason : • Refresh rate of monitor is slower than frame rate of the motion picture. • Refresh = movement of liquid ( slow in LCD’s compared to CRT’s) • Can also be produced due to rendering or decompression.
Our Proposal • Reduce the artifacts with post-processing. • Use principles of color perception by HVS. • Implement an Image Quality Metric to measure these artifacts numerically.
HVS and Color Perception • Perception of color is generated in photoreceptor cells : rods and cones • Brightness and color follow seperate paths in HVS. • Perception of shape and motion is based on brightness, so HVS is more sensitive to brightness changes.
HVS and Color Perception • Other properties of HVS to be considered : • Having linear and nonlinear parts • Chromatic and light adaptation • Contrast encoding relative to background and surround color • Varying sensitivity to spatial frequencies.
Color Spaces • There are many color models used by different devices. They can be converted to each other with a linear formula. RGB, HSV, CMY, CIE XYZ, LAB, LUV etc. • Color space components are called “channels” or “bands”.
Color Spaces • RGB : Simplest color model, but can’t produce all colors. • Since HVS treats color and brightness seperately, we should use a model that seperates luminance and chrominance. LAB, LUV, YIQ etc.
Color Spaces • YIQ : Used by NTSC. Brightness and color are seperated. • NTSC gives more bandwidth to luminance. • Y : 4.5 MHz • I : 1.5 MHz • Q : 0.6 MHz
YIQ Color Space YIQ RGB Y I Q
Perceptual Uniformity • Unit change in luminance and chrominance are uniformly perceptible by HVS. • CIE LUV and CIE LAB are perceptually uniform, so they are commonly used in color quantization.
Chroma Shifting • Chroma shifting is a kind of translation problem, produced when one or more channels of an image are generated asynchronously. • Solution : • Find how much each channel is shifted. • Shift back.
Chroma Shifting • How to find how shifted a channel is : • Detect edge points of 3 channels of the distorted image. • Canny edge detection, with high threshold and sigma ( we don’t need every detail) • Correlate edge points from each channel to find the shift and its direction. • 81 neighbors of each pixel are searched, to find corresponding edge point in other channels.
Chroma Shifting Example Original Image 2.nd channel shifted by 3x4 Edges in 1st channel Edges in 2nd channel
Chroma Shifting Example • For each edge point e1(i,j) in first channel, we check its 81 numbered neighbors( e2(i+/-4, j+/-4) ) in second channel, and save their numbers if they are also edge points. • The neighboring edge point number with maximum occurence is found. • If the second channel is shifted by x,y , then most edge points e1(i,j) will have corresponding edge point in e2(i+x,j+y).
Image Quality Metrics • Measure the quality loss of the distorted images, comparing with the originals. • Image quality depends on sharpness, noise, blur, graininess etc. A good quality metric should reflect these all. • The alternative way to measure image quality is subjective tests, involving real observers.
Image Quality Metrics • Categorized into 6 groups: • Pixel Difference Based • Correlation Based • Edge Based • Spectral Distance Based • Context Based • Human Visual System Based • Most populars are MSE and SNR.
MSE and MSE_LAB • MSE is based on Minkowsky average distance between pixels of two images • A more reliable version is MSE_LAB, which is MSE calculated in LAB space.
MSE_LAB_WEIGHTED • HVS is more sensitive to luma changes, so luma differences should cost much more than chroma. • NTSC uses this fact by giving more bandwidth to luma. (4.5, 1.5 and 0.6 MHz for Y,I,Q channels).
HVS Based Metrics • A HVS based metric should take these into account : • Relative luminances rather than absolute luminances are sensed by the eye. The model should account for luminance variations, not absolute values. • The perceived brightness is a non-linear function of luminance. • The sensitivity of eye depends on spatial frequency of luminance variations.
HVS Based Metrics • The model I used : • The luminance values are normalized by mean luminance. • Nonlinearity in perception is taken into account by taking the cube root of normalized luminance values. • Transformed to Fourier domain with FFT. • Weighted with contrast sensitivity function. • MSE calculated.
HVS Based Metrics • We pay more attention to perceptually important elements, using CSF. • There are other weight functions.
Contrast Sensitivity Function • The human perception system doesn’t respond equally to all spatial frequencies. • The eye is less sensitive to extremely gradual changes • The eye is fairly sensitive to more rapid changes • The eye is decreasingly sensitive to yet higher spatial frequencies Contrast Sensitivity vs Spatial Freq.
Contrast Sensitivity Function • There are many models to implement CSF. • I used Mannos and Sakrison’s. where f is the Fourier Transform of the image.
Activity Sensitivity Function • HVS is more sensitive to errors in low activity areas than higher activity regions
Gazing Point Distribution Important areas of the image should have more precision in calculations.
Metric Results Original G shifted 1x1, B shifted 2x2 G shifted 3x3, B shifted 4x4 Metric1 vs 2 1 vs 3 2 vs 3 MSE 0.0040 0.0088 0.0052 MSE_LAB 56.3681 108.7822 90.1370 MSE_LAB_WEIGHTED 27.5340 67.2947 49.2731 HVS_BASED 67.6913 75.1936 72.4047
Metric Results Original A shifted 1x1, B shifted 2x2 A shifted 3x3, B shifted 4x4 Metric 1 vs 2 1 vs 3 2 vs 3 MSE 0.0009 0.0028 0.0011 MSE_LAB 13.3186 45.7215 19.1150 MSE_LAB_WEIGHTED 1.7619 8.2902 4.1979 HVS_BASED 44.7906 62.2324 55.8743
Conclusion • Chroma-shifting problem was studied in detail. An edge quality based solution was introduced. • Image quality metrics were examined. A HVS based metric was implemented, using CSF as the importance weight. • A new metric MSE_LAB_WEIGHTED was introduced and found to produce reliable results compared to existing ones on chroma-shifted images.
References [1] İsmail Avcıbaş PhD Thesis, “Image Quality Statistics and Their Use in Steganalysis and Compression”, 2001 [2] K.Miyata, M.Saito, N.Tsumura, H.Haneishi, Y.Miyake, “Eye Movement Analysis and its Application to Evaluation of Image Quality”. [3] H.Rushmeier, G.Ward, C.Piatko, P.Sanders, B.Rust, “Comparing Real and Synthetic Images: Some Ideas About Metrics”,. [4] S.Titov, “Perceptually Based Image Comparison Method”, 2000 [5] Mahesh Ramasubramanian Master Thesis, “A perceptually Based Phsical Error Metric for Realistic Image Synthesis”, 2000 [6] S.Winkler, “Qaulity Metric Design: A Closer Look”. [7] Doğan Özdemir PhD Thesis, “Fuzzy Approaches in Quantization and Dithering of Color Images”, 1999 [8] J.F.Delaigle, C.Devleeschouwer, b.Macq, I.Langendijk, “Human Visual System Features Enabling Watermarking”, 2002 [9] J.Bai, T.Nakaguchi, N.Tsumura, Y.Miyake, “Evaluation of Image Corrected by Retinex Method Based on S-CIELAB and Gazing Information”, 2002 [10] Vladimirovich Komogortsev PhD Thesis, “Eye Movement Prediction by Occumulator Plant Modeling with Kalman Filter”, 2007