Download
1 / 17
170 likes | 336 Views
Using McIDAS-V for Satellite-Based Thunderstorm Research and Product Development Kristopher Bedka UW-Madison, SSEC/CIMSS In Collaboration With: Tom Rink, Jessica Staude, Tom Whittaker, Wayne Feltz, and the UW-CIMSS S atellite N owcasting and A viation A pplications P rogram (SNAAP).

E N D
Using McIDAS-V for Satellite-Based Thunderstorm Research and Product Development Kristopher Bedka UW-Madison, SSEC/CIMSS In Collaboration With: Tom Rink, Jessica Staude, Tom Whittaker, Wayne Feltz, and the UW-CIMSS Satellite Nowcasting and Aviation Applications Program (SNAAP)
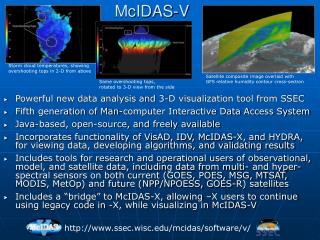
UW-CIMSS Satellite-based Thunderstorm Research • Through the support of NASA and NOAA, UW-CIMSS is developing objective satellite-based decision aids to: • Identify “overshooting tops” and “the enhanced-V signature” which often indicate the presence of severe weather, frequent lightning, and aviation turbulence • Improve forecasting of future thunderstorm development • Products are developed for: • Implementation at NCAR Research Applications Lab (RAL) and MIT-Lincoln Labs within “expert systems” for turbulence detection and aviation flight planning • Future operational use at NOAA within the GOES-R Advanced Baseline Imager (ABI) program through the GOES-R Aviation Algorithm Working Group (AWG) • A diverse group of datasets are needed to develop and validate these products, each of which have differing resolution (spatial, temporal, and spectral) and data format/structure • McIDAS-V provides the tools to synchronize these data and our products in a unified framework, offering display and analysis capabilities provided by no other visualization software
Datasets Shown In This Presentation 1) 2 km Weather Research and Forecasting (WRF) NWP Model Simulation (NetCDF) 2) 2 km Synthetic GOES-R ABI Imagery (NetCDF) 3) 1 km MODIS IR Window Imagery (HDF) 4) 0.25 km MODIS Visible Imagery (HDF) 5) CloudSat Cloud Profiling Radar (2B-GEOPROF) Vertical Profiles (HDF) 6) CALIPSO Level 1 Backscatter (HDF) 7) Objective MODIS Overshooting Top and Anvil BT Couplet Detections (ASCII Text) 8) 4 km GOES IR Window Imagery (AREA acquired via SSEC ADDE) 9) MODIS Multispectral Infrared Channel Differencing (HDF via McIDAS-V Display Tool) 10) Severe Weather Reports (ASCII Text) 11) National Lightning Detection Network (ASCII Text) 12) NSSL National Composite Reflectivity Mosaic (NetCDF) 13) United Airlines Eddy Dissipation Rate (EDR) Objective Turbulence Observations (NetCDF) Blue Text: Datasets Configured for Display in McIDAS-V at CIMSS
Cloud Isosurface with IR Temperature and In-Cloud Ice Content WRF Cloud Water Isosurface Colored By Synthetic 2 km GOES-R ABI IR Window Brightness Temperatures WRF Cloud Water Isosurface Colored by WRF 3-D Temperature Field 2-3 km Above Surrounding Anvil Cloud 2 km WRF Cloud Ice Content 175 hPa 200 hPa 150 hPa • We used these visualizations to learn that a single overshooting top (OT) is < 15 km in diameter and is co-located with significant vertical transport of ice into the stratosphere. Stratospheric ice content can be used to validate the accuracy of OT detections from synthetic GOES-R ABI imagery
Cloud Isosurface Animation With Synthetic ABI IR Temperature • We used these WRF simulations and visualizations to learn that a single overshooting top persists for ≤ 15 mins and that gravity waves can propagate far away (> 50 km) from their source region, representing a turbulence hazard for aviation interests
1 km MODIS IR Window 1 km MODIS IR Window 1 km MODIS IR Window
CloudSat and CALIPSO Profile Track 0.25 km MODIS Visible 0.25 km MODIS Visible
CloudSat Cloud Profiling Radar Reflectivity (2B-GEOPROF) CALIPSO Level 1 Backscatter
Ideal Multisensor Data Plot Using MATLAB • We used 6 input files and ~175 lines of matlab code to generate this plot which shows overshooting top detections and MODIS brightness temperature transects along the CloudSat and CALIPSO overpass from the previously shown case • McIDAS-V would need to have capability to share multiple transects and cross-sections, display overshoot detection point data on this transect display, and support for Level 2 CALIPSO tropopause (from GEOS-5 NWP) and cloud top height. User adjustments to axis tick mark label frequency, axis labels (and font type/size), and a plot legend editor would also be required
1 km MODIS IR Window on GOES-12 Projection 4 km GOES-12 IR Window
MODIS 0.25 km Visible with OT Detections,Anvil BT Couplets,andTime Matched Severe Hail Reports 1 km WV-IR Window BT Difference This example shows that the UW-CIMSS overshooting top detection method produces fewer false alarms than the well-documented WV-IR Window BT difference OT detection technique UW-CIMSS anvil BT couplet (i.e. “enhanced-V”) detections correlate well with storms producing severe hail MODIS 1 km IR Window BT with OT Detections,Anvil BT Couplets,andTime Matched Severe Hail Reports
GOES-12 with Radar Reflectivity, Lightning, and Aviation Turbulence • UW-CIMSS (in collaboration with NCAR RAL and UAH) is studying the relationship between satellite observations of convection, ground-based lightning, and aviation turbulence to develop objective satellite feature detection algorithms that can help improve aviation safety Nexrad 1 km Composite Reflectivity Mosaic GOES-12 IR Window Imagery United Airlines Objective In-situ Turbulence Data Blue=Non-Turbulent Green=Turbulence NLDN Cloud-to-Ground Lightning
Objective Satellite-based Thunderstorm Development Forecasting • UW-CIMSS is using cloud “object” detection software (WDSS-II) developed at OU-CIMMS and NSSL to monitor time trends in cloud top temperature which can be used to objectively forecast future thunderstorm development WDSS-II Cloud Object Identification Colored by the Mean Object IR Window BT White Arrows: 2-D Object Motion Field, Arrow Length Proportional to Speed GOES-12 IR Window BT
Recipe For a McIDAS-V Friendly NetCDF File Though our files are not “CF-compliant”, the following structure will display properly in McIDAS-V
Benefits of McIDAS-V to UW-CIMSS Thunderstorm Research • The ability to combine 2-D satellite imagery, 2-D space-based vertical profiles, and 3-D cloud fields to better understand storm vertical structure and/or time evolution • Support for a diverse array of datasets...ability to display user-generated products and “point” validation data in combination with “traditional” satellite/radar imagery • Comprehensive capability for multispectral image analysis via Hydra tools • Automatic navigation of datasets of varying spatial resolution • Powerful utility to time sync and animate data of varying temporal resolution • The “little things” important for publication and presentation quality graphics • Multiple animation options, Quicktime .mov, .avi, Animated .gif • Ability to design new color enhancements and easily adjust data display ranges • Plot annotations with text, arrows, and shapes • Options for easy color bar display with adjustable font size/type for labelling