Download
1 / 12
120 likes | 163 Views
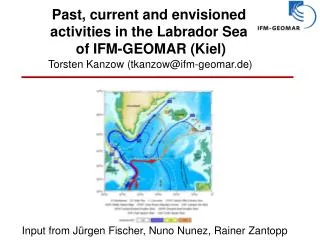
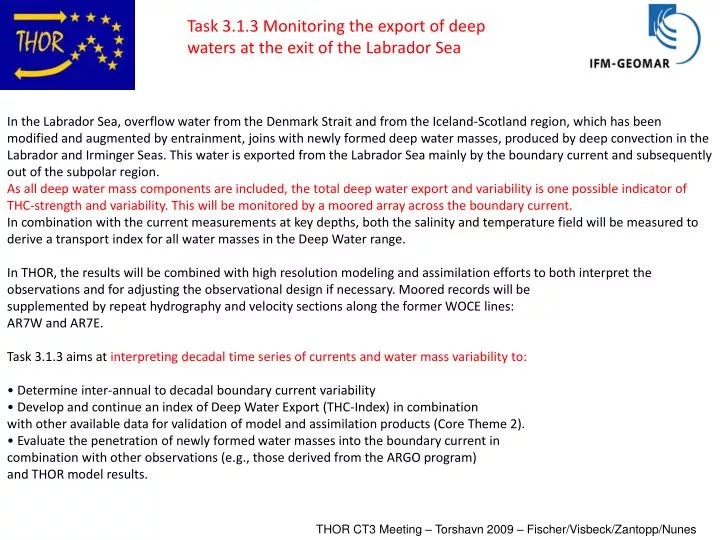
Task 3.1.3 Monitoring the export of deep waters at the exit of the Labrador Sea.

E N D
Task 3.1.3 Monitoring the export of deep waters at the exit of the Labrador Sea In the Labrador Sea, overflow water from the Denmark Strait and from the Iceland-Scotland region, which has been modified and augmented by entrainment, joins with newly formed deep water masses, produced by deep convection in the Labrador and Irminger Seas. This water is exported from the Labrador Sea mainly by the boundary current and subsequently out of the subpolar region. As all deep water mass components are included, the total deep water export and variability is one possible indicator of THC-strength and variability. This will be monitored by a moored array across the boundary current. In combination with the current measurements at key depths, both the salinity and temperature field will be measured to derive a transport index for all water masses in the Deep Water range. In THOR, the results will be combined with high resolution modeling and assimilation efforts to both interpret the observations and for adjusting the observational design if necessary. Moored records will be supplemented by repeat hydrography and velocity sections along the former WOCE lines: AR7W and AR7E. Task 3.1.3 aims at interpreting decadal time series of currents and water mass variability to: • Determine inter-annual to decadal boundary current variability • Develop and continue an index of Deep Water Export (THC-Index) in combination with other available data for validation of model and assimilation products (Core Theme 2). • Evaluate the penetration of newly formed water masses into the boundary current in combination with other observations (e.g., those derived from the ARGO program) and THOR model results. THOR CT3 Meeting – Torshavn 2009 – Fischer/Visbeck/Zantopp/Nunes
Task 3.1.3 Monitoring the export of deep waters at the exit of the Labrador Sea • Herein thefocusis on theinterpretationofthedataandthegenerationofproductsforthe THOR modellingandassimilationcommunity -- • Plans forthefirst 18 months: • Moored Array isdesignedfornextdeploymentperiod: May 2009 to Summer 2010 • -------moorings recovered and deployed------- • Update ofexisting hydrographic (including Argo) andmooringdataforestimating interannual • todecadalvariabilityof DWBC exportfromLabrador Sea (underway) • index of deep water export in the DWBC (THC-index) will be developed and continued • makedataandproductsavailabletootherWP‘s (Modeling andobservationalgroups) • Fieldprogram: • Joint (Quadfasel/Fischer) cruisewith RV Merian in May/June 2009 finished • Proposed (Quadfasel/Fischer) cruisewith RV Meteor in summer 2010 -- approved THOR CT3 Meeting – Torshavn 2009 – Fischer/Visbeck/Zantopp/Nunes
D06: Reference data set for pre-existing data on properties and fluxes through key sections: Greenland-Scotland Ridge, Deep Western Boundary Current and across 26.5° N. (Month 12) LS BoundaryCurrent Data Twoyearswithfullarray 10 yearsreducedcoverage Reduced Array regress to EOF‘s Full Array Structure by EOF‘s Integrate 12 y BC Expl. Variances Transport + Error time series Det. of uncertainties Science THOR
53°N Current meter array at 53°N in 1997-1999 and actual array 2009-2010 Complete array from June 1997- July 1997 only 1999-2001: 2 moorings 2001-2003: 3 moorings 2003-2005: 1 mooring 2005-2007: 1 mooring 2007-2009: 3 moorings 2009-2011: 5 moorings planned (funded elsewhere) Present -- DSOW part will be strengthened THOR CT3 Meeting – Torshavn 2009 – Fischer/Visbeck/Zantopp/Nunes
Task 3.1.3 Monitoring the export of deep waters at the exit of the Labrador Sea 53°N • temperature at 1500m increases by about 0.05° per year between 1997 and 2007 • Are there any trends for the other water masses? Igor Y. works • on DSOW variability --- collaboration envisioned Average 1997-1999 2000-2005 K2: 0.14m/s 0.17m/s k9: 0.12m/s 0.15m/s THOR CT3 Meeting – Torshavn 2009 – Fischer/Visbeck/Zantopp/Nunes
K7 K8 K9 K10 K16 Task 3.1.3 Monitoring the export of deep waters at the exit of the Labrador Sea • Overview of available current data at single station K9; rotated to 310° for mean outflow direction • annual mean profiles and decadal mean • Variations O 20% of decadal mean THOR CT3 Meeting – Torshavn 2009 – Fischer/Visbeck/Nunes
Task 3.1.3 Monitoring the export of deep waters at the exit of the Labrador Sea Short term variability Intraseasonal Variability: Max near surface Peak 10-20 day periods Min at DSOW Level, but mean is highest No sytematic variations of energy level THOR CT3 Meeting – Torshavn 2009 – Fischer/Visbeck/Nunes
Task 3.1.3 Monitoring the export of deep waters at the exit of the Labrador Sea • EOF‘s 1997-1999 • Mode 0 – mean flow field • Mode 1 – LC-mode with annual cycle • Mode 2 – meander mode • Mode 3 – BC pulsation Modes for annual subsets very similar! Modes 1-3 explain 80% of the variance THOR CT3 Meeting – Torshavn 2009 – Fischer/Visbeck/Nunes
Task 3.1.3 Monitoring the export of deep waters at the exit of the Labrador Sea Mean Spectra of EOF time series (above) – max high frequency energy in meander mode (2) at 10 to 30d periods Explained variance plot (rhs) – K10 and K9 are most important for variance
Task 3.1.3 Monitoring the export of deep waters at the exit of the Labrador Sea Reference-Dataset (40 hlpdata) southward Transports only time period 1997 – 1999 from 500m tothebottom 12h resolution Low-passed at 10d includesmeanders Low-passed at 60d nomeanders Green lineisfortwoyearmean transport (32.4Sv) belowsth=27.68 THOR CT3 Meeting – Torshavn 2009 – Fischer/Visbeck/Zantopp/Nunes
Task 3.1.3 Monitoring the export of deep waters at the exit of the Labrador Sea Special Focus on DSOW core --- LADCP and Moorings
Task 3.1.3 Monitoring the export of deep waters at the exit of the Labrador Sea Time series of DSOW at various places in the SPNA (I. Yashayaev, pers. com.) CTD measurements aided by moored instruments (microcats)