
Uploaded by
makya
1 SLIDES
146 VIEWS
10LIKES
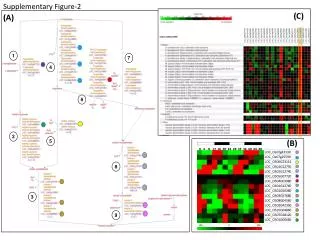
Analysis of Supplementary Figure 2: Data Trends and Insights
DESCRIPTION
This document presents a detailed examination of Supplementary Figure 2, which includes a comprehensive analysis of data presented in parts (C) and (A). The figure contains a series of graphical representations spanning critical numerical ranges (1.7 to 48 on the x-axis and -100 to 100 on the y-axis). The analysis focuses on identifying key trends, patterns, and statistical relevance within the data, contributing to better understanding of the underlying phenomena being studied.
Download
1 / 1
Download Presentation 
Analysis of Supplementary Figure 2: Data Trends and Insights
An Image/Link below is provided (as is) to download presentation
Download Policy: Content on the Website is provided to you AS IS for your information and personal use and may not be sold / licensed / shared on other websites without getting consent from its author.
Content is provided to you AS IS for your information and personal use only.
Download presentation by click this link.
While downloading, if for some reason you are not able to download a presentation, the publisher may have deleted the file from their server.
During download, if you can't get a presentation, the file might be deleted by the publisher.
E N D
Presentation Transcript
Supplementary Figure-2 (C) (A) 1 7 4 6 2 5 0 4 8 12 16 20 24 28 32 36 40 44 48 (B) 8 -100 0 100 3 9


More Related