Download
1 / 12
140 likes | 565 Views
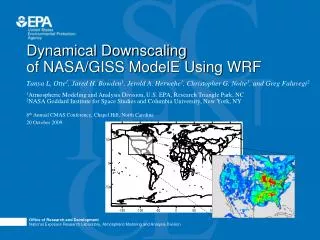
Dynamical Downscaling of NASA/GISS ModelE: Continuous, Multi-Year WRF Runs. Tanya L. Otte 1 , Jared H. Bowden 1 , Christopher G. Nolte 1 , Martin J. Otte 1 , Jonathan E. Pleim 1 , Jerold A. Herwehe 1 , Greg Faluvegi 2 , and Drew T. Shindell 2

E N D
Dynamical Downscaling of NASA/GISS ModelE:Continuous, Multi-Year WRF Runs Tanya L. Otte1, Jared H. Bowden1, Christopher G. Nolte1, Martin J. Otte1, Jonathan E. Pleim1, Jerold A. Herwehe1, Greg Faluvegi2, and Drew T. Shindell2 1 U.S. EPA, Research Triangle Park, North Carolina 2 NASA/Goddard Institute for Space Studies, New York, New York 9th Annual CMAS Conference, Chapel Hill, NC 11 October 2010
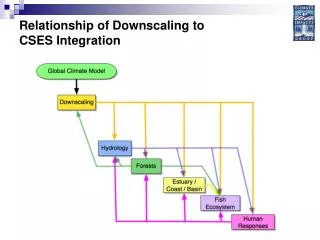
Why are we performing this research? Regional Impacts ofClimate Change - Effects on air quality and environment - Assessment, mitigation - Detailed local land cover, topography, etc. Global Climate - Comprehensive science - Emissions scenarios - Multi-century data - Coarse resolution Regional Climate Modeling a.k.a. Downscaling Large, well-established programs Our interests
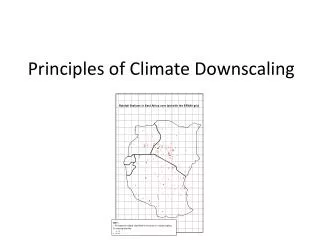
What is “dynamical downscaling”? Global climate model (GCM) creates coarse gridded future climate with world-wide coverage. GCM RCM Regional climate model (RCM) generates griddedhigher-resolution climate predictions over focal area. • More detail in local effects from: • scale-appropriate physics • topography & land/water interfaces • urban areas (population centers) • precipitation patterns
Our Research Problem…Simplified Constraint of RCMtoward GCM Freedom of RCM todevelop smaller-scaleprocesses delicate balance Keeps RCM climateconsistent with GCM Decreases variability Allows RCM climateto deviate from GCM Increases variability More constraint toward GCM Less constraint toward GCM RCM to be constrained to GCM using nudging.
Downscaling Configuration • NASA/GISS ModelE (6 years, ca. 2000) • 1 of 3 U.S. GCMs in IPCC AR5 • Coupled atmosphere-ocean model creates GCM forecast • 2.0° x 2.5°, 6-h fields, 40 s-p layers up to 0.1 hPa • Use native vertical layers in downscaling • Validate WRF vs. ModelE • WRFv3.2 • 108-km domain, 34 layers, model top at 50 hPa • CAM LW and SW Radiation • WSM6 Microphysics • Yonsei University PBL • NOAH Land-Surface Model • Grell Cumulus Parameterization • Various analysis and spectral nudging configurations
Domains and Topography ModelE (cropped to WRF domain and projection) WRF at 108-km
mean maximum 95th %ile 90th %ile 75th %ile 50th %ile 25th %ile 10th %ile 5th %ile minimum Multi-year downscaled simulations (even without nudging) can capture interannual variability from the GCM. Monthly Area-Averaged 2-m Temperature Distribution (Plains) for “2002-2007” ModelE (“obs”) No Nudging Increased range “2002” “2003” “2004” “2005” “2006” “2007” Analysis Nudging Spectral Nudging
Multi-year WRF runs using ModelE have persistent and systematic regional and seasonal biases, even with nudging. Monthly Area-Averaged 2-m Temperature Difference by Region Midwest Northwest Northeast 2002 2003 2004 2005 2006 2007 No Nudging distinct cold bias nearly zero annual bias 4 Nudging Options Southeast Plains Southwest annual periodicity of biases annual periodicity of biases annual periodicity of biases Apr. Jan. Sept. Sept. Sept. Sept. Sept. Sept. Result of inconsistencies in GCM/RCM physics or errors in modeling physical processes? Corroborate with multi-year reanalysis runs?
Multi-year WRF runs using ModelE can broadly capture month-to-month trends in precipitation within different regions. Monthly Area-Averaged Accumulated Precipitation Difference by Region Midwest Northwest Northeast 2002 2003 2004 2005 2006 2007 Southeast Plains Southwest
WRF ModelE Subtle changes in nudging strategy can have a large impact on results. Plains U.S. region Precipitation Analysis Nudging (Sens. 1) It’s not just about whether or not nudging is used but how it is used. 2-m Temperature J F M A M J J A S O N D J F M A M J J A S O N D Precipitation Analysis Nudging (Sens. 2) 2-m Temperature J F M A M J J A S O N D J F M A M J J A S O N D
One size (configuration) will not fit all (regions and applications). 6-Year Monthly Error from 17 Nudging Sensitivities 2-m Temperature Difference (Plains U.S. region) Strategy may ultimately be dictated by application and region(s) of interest.
Next Steps • Analysis of upper-air and column-averaged fields • Space-time analysis • Additional nudging sensitivities, as warranted by analysis • Nested (36-km) runs and nesting strategies • Longer time slices (and climate change)