Download
1 / 23
230 likes | 451 Views
ELECTION INVERSIONS UNDER PROPORTIONAL REPRESENTATION. Nicholas R. Miller Public Choice Society Meeting March 8-10, 2013. Election Inversions under Plurality. Election Candidates/Parties Votes* Seats US Presidential 2000 George W. Bush 49.73% 271

E N D
ELECTION INVERSIONSUNDER PROPORTIONAL REPRESENTATION Nicholas R. Miller Public Choice Society Meeting March 8-10, 2013
Election Inversions under Plurality Election Candidates/Parties Votes* Seats US Presidential 2000 George W. Bush 49.73% 271 Albert Gore, Jr. 50.27% 267 US Congressional 2012 Republican ~49.4% 234 Democratic ~50.6% 201 UK General 1951 Conservative (+Nat Lib) 49.58% 321 Labour 50.42% 295 Canada General 1979 Conservative 47.22% 136 Liberal 52.78% 114 US Presidential 1860 Abraham Lincoln (R) 39.7% 180 Stephen A. Douglas (ND) 29.5% 12 John Breckinridge (SD) 18.2% 72 John Bell (CU) 12.6% 39 US Presidential 1860 Abraham Lincoln 39.7% 169 [Hypothetical Straight Fight] Anti-Lincoln 60.3% 134 * Vote percentages based on parties shown only.
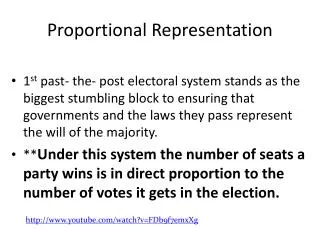
More Surprising: Election Inversions under PR • PR characteristically produces multiparty systems in which no party wins a majority of seats and governments are based on coalitions. • Thus potential inversions pertain primarily to coalitions, not individual parties. Election Party Coalitions Votes Seats Netherlands 2010 PVD + PVV + CDU 49.55% 76 All other parties 50.55% 74 Israel 1981 Likud + small parties 48.2% 61 All other parties 51.8% 59 Denmark 1990 Rightwing coalition 49.7% 91 Leftwing coalition 50.3% 84 Israel 2013* Likud + JH + Shas + UTJ 46.4% 61 All other parties 53.6% 59 Israel 2013* Likud + YeshAtid + Shas 46.4% 61 All other parties 53.6% 59 *These are both somewhat plausible governing coalitions; the actual government has not yet been formed.
PK-K on Election Inversions in Denmark • The possibility of [coalitionwise] election inversions under [Danish] PR was first pointed out by Peter Kurrild-Klitgaard in a paper presented at the World Congress of Public Choice Societies last year. • My paper originated as discussant commentary on PK-K’s paper. • However, his examples result from avoidable imperfectionsin the Danish (and most other) proportional representation systems, • that are deliberately introduced to serve goals other than proportionality, e.g., • to provide local representationby using regional districts; • to deter excessive party proliferation by setting a minimum vote threshold a party must meet in order to win seats. Peter Kurrild-Klitgaard. “Election Inversions, Coalitions and Proportional Representation: Examples of Voting Paradoxes in Danish Government Formations.” Scandinavian Political Studies, 2013, forthcoming.
The Unavoidable Imperfection in PR • Here I carry PK-K’s analysis a step further by showing that election inversions can and do occur under even the purest types of proportional representation —namely, ones that • use a single national constituency (without districts), • impose no explicit vote threshold to win a seat, and • employ a highly proportional electoral formula. • Even the purest proportional representation systems have unavoidable imperfections that result from the “whole number problem,” i.e., • the fact parties must be awarded seats in terms of relatively small whole numbers, • while their vote support comes in terms of far larger numbers, • making party vote shares essentially continuous quantities.
The Danish Electoral System • The Danish electoral system is based on • 135 seats apportioned on the basis of population among about a dozen multi-member districts of varying magnitudes, • 40 national adjustment seats, and • two seats for each of two autonomous overseas territories (Greenland and the Faroe Islands). • The latter four seats are guaranteed regardless of population, • And in fact give the overseas territories disproportionate representation. • The 40 national adjustment seats effectively create a single “continental” constituency with 175 seats • allocated among political parties on the basis of the (quite proportional) modified Sainte-Laguë formula • with a 2% national threshold. • Thus the Danish system departs from pure PR in primarily in two respects: • the “federal” status the territories, and • the 2% threshold. • The inversions that PK-K identifies are due to what he calls “federal effects” and “threshold effects,” which result from these two avoidable imperfections in the Danish PR system.
“Federal Effects” • “Federal effects” are a special case of apportionment effects(Miller, 2012) in an electoral system based on states, regions, or other geographically defined districts; • they cannot occur in undistricted systems. • In 1971, the coalition of all center-right parties gained a bare majority of both votes and seats in “continental” Denmark. • But a left-of-center coalition secured the support of the three of the four overseas representatives, thereby securing a bare majority seats in parliament without also securing a majority of the vote nationwide (because of the over-representation of the territories). • However, due to peculiarities in the party systems in the two territories, there may be some ambiguity as to whether this represented a true coalitionwise inversion. N. R. Miller, “Election Inversions by the U.S. Electoral College,” in D. S. Felsenthal and M. Machover, eds., Electoral Systems: Paradoxes, Assumptions, and Procedures, Berlin: Springer, 2012
“Threshold Effects” • “Threshold effects” are a special case of what Miller calls distribution effects. • In non-PR systems, distribution effects result when one party’s vote is more “efficiently” distributed over districts than another’s. • Under PR, the most obvious source of “inefficiently” distributed votes occurs when several small parties fail to win any seats, • whereas a single larger party with the same total vote would win one or more seats. • A (thus far) hypothetical example of an inversion under PR due to “threshold effects”:
“Threshold Effects” (cont.) • In the 1990 election [previously displayed], • with respect to “continental” Denmark only, the parties of the left collectively won a bare majority of the votes • but the parties of the center-right won a decisive majority of the seats, • while no plausible accounting for votes in the overseas territories could give the center-right party an overall majority of the vote. • The inversion resulted because a number of small leftist parties (but only one rightist one) each fell below the 2% threshold and failed to win any seats, • despite collectively winning 4.4% of the total vote. • Like supporters of minor parties under plurality voting, supporters of these parties “wasted” their votes. • If they had voted “tactically,” they could have concentrated their votes on a single leftist party that would have met the 2% threshold and won an (approximately) proportional share of the seats and given the left coalition a parliamentary majority.
Election Inversions under Pure PR • But neither federal nor threshold effects are necessary for election inversions under PR. • Nor is it necessary for any vote-winning parties to be denied seats. • Provided that there are three or more parties, coalitionwise election inversions can occur under even the purest types of proportional representation, i.e., those with a single nationwide district, no threshold requirement, and a highly proportional electoral formula. • and even if all (vote-winning) parties win seats, or • vote percentages are based on seat-winning parties only. • A partial inversion: two (or more) parties win equal numbers of seats, even though almost certainly one wins more votes.
Election Inversions under Pure PR (cont.) • An undistricted proportional representation system, cannot produce a (full as opposed to partial) partywise inversion, • because every PR formula awards party A at least as many seats as party B if A wins more votes than B. • The most proportional PR formulas are • Largest Remainder-Hare (LR-H), and • (unmodified) Sainte-Laguë which allocate seats almost the same way • Since the claim is only that such inversions are possible, it is sufficient to provide a hypothetical example. • The table on the following slide provides two closely related examples, • both involving just three parties and 35 seats.
Hypothetical Coalitionwise Inversions under Pure PR (LR-H or Sainte-Laguë) with 35 Seats
A Note on “Coalitions” • The word “coalition” is used in two distinct ways in formal political theory. • In the more general sense, a coalition refers merely to any set of players (e.g., voters or parties). • This is standard terminology in the theory of simple games and in voting power theory. • In the narrower sense, a coalition is a particular set of players who enter into an agreement, e.g., a “governing coalition.” • We use the term here in the more general sense. • However, Kurrild-Klitgaard’s examples of coalitionwise inversions in Danish politics pertain to sets of ideologically compatible parties that became (governing) coalitions. • Likewise the other introductory examples pertained to actual or plausible governing coalitions. • We are examining the properties of PR, which deals only with the numbers of votes and seats, • not ideological/policy position of parties or actual coalition formation.
“Coalitions” vs. “Fusions” of Parties • PR formulas treat “coalitions” of parties and “fusions” of parties differently, and therefore permit coalitionwise inversions but not partywise inversions. • If parties B and C in the preceding table were fused into a single party, no inversions would occur. • The vote profiles in the preceding table 2 were carefully devised, • by giving party A either slightly more or slightly less than half of the vote, and then • by “tuning” the division of the residual vote between parties B and C in relation to the total number of seats. • If there are relatively many parties with varying levels of vote support, inversion possibilities likely become more frequent — indeed perhaps typical.
Finding Inversion Possibilities • A party’s seat differential: seats won – quota. • Look for coalitions that • control a small majority of seats and • are composed of parties all or most of which have positive seat differentials, • and which therefore are likely to have the support of less than a majority of voters. • There is one easy way to construct hypothetical examples of inversion possibilities: • allow the number of small non-seat-winning parties to proliferate. • Even without an explicit threshold, parties that are small enough fail to win seats by the normal operation of the PR formula. • It then will be easy to find coalitions of seat-winning parties that control a majority of seats with less than a majority of the total vote. • Therefore, we further inquire whether we can find empirical examples of election inversions under PR when the analysis is restricted to seat-winning parties and the votes cast for them.
Israel and Netherlands • Israel and the Netherlands are generally regarded as having the “purest” PR systems. • Both PR systems use: • a single nationwide constituency • Netherlands has districts, but they do not affect the overall allocation of seats to parties. • relatively low thresholds • Netherlands: 0.67% • Israel: once 1%, then 1.5%, now 2%), • but the D’Hondt formula (less propotional,favoring large parties). • So we also “purify” their seat allocations • by removing any explicit threshold, and • replacing D’Hondt with Sainte-Laguë and/or Largest Remainder-Hare.
U.S. House Seats (based on 2010 Census) • Hill-Huntington formula (~St-L or LR-H) • “floor” vs. “threshold” but no present effect • more seats and many more “parties” (all “seat-winning”) • state “coalition” possibilities are extraordinarily numerous • rank state in order or seat differentials are then adjust at margin