Download
1 / 22
240 likes | 622 Views
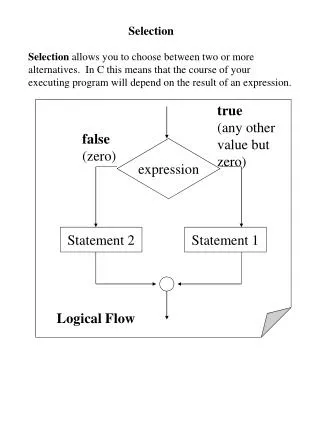
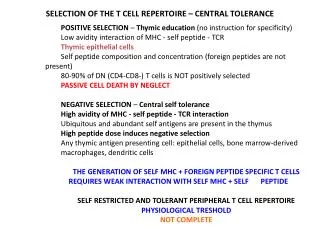
Positive selection. A new allele (mutant) confers some increase in the fitness of the organism Selection acts to favour this allele Also called adaptive selection or Darwinian selection. NOTE : Fitness = ability to survive and reproduce.

E N D
Positive selection • A new allele (mutant) confers some increase in the fitness of the organism • Selection acts to favour this allele • Also called adaptive selection or Darwinian selection. NOTE: Fitness = ability to survive and reproduce Modified from from www.tcd.ie/Genetics/staff/Aoife/GE3026/GE3026_1+2.ppt
Negative selection • A new allele (mutant) confers some decrease in the fitness of the organism • Selection acts to remove this allele • Also called purifying selection Modified from from www.tcd.ie/Genetics/staff/Aoife/GE3026/GE3026_1+2.ppt
Neutral mutations • Neither advantageous nor disadvantageous • Invisible to selection (no selection) • Frequency subject to ‘drift’ in the population • Random drift – random changes in small populations
Measuring Selection on Genes • Null hypothesis = neutral evolution • Under neutral evolution, synonymous changes should accumulate at a rate equal to mutation rate • Under neutral evolution, amino acid substitutions should also accumulate at a rate equal to the mutation rate From: mentor.lscf.ucsb.edu/course/spring/eemb102/lecture/Lecture7.ppt
Counting #s/#a Ser Ser Ser Ser Ser Species1 TGA TGC TGT TGT TGT Ser Ser Ser Ser Ala Species2 TGT TGT TGT TGT GGT #s = 2 sites #a = 1 site #a/#s=0.5 To assess selection pressures one needs to calculate the rates (Ka, Ks), i.e. the occurring substitutions as a fraction of the possible syn. and nonsyn. substitutions. Things get more complicated, if one wants to take transition transversion ratios and codon bias into account. See chapter 4 in Nei and Kumar, Molecular Evolution and Phylogenetics. Modified from: mentor.lscf.ucsb.edu/course/spring/eemb102/lecture/Lecture7.ppt
Types of Mutation-Substitution • Replacement of one nucleotide by another • Synonymous (Doesn’t change amino acid) • Rate sometimes indicated by Ks • Rate sometimes indicated by dS • Non-Synonymous (Changes Amino Acid) • Rate sometimes indicated by Ka • Rate sometimes indicated by dN (this slide is from mentor.lscf.ucsb.edu/course/ spring/eemb102/lecture/Lecture7.ppt)
Low number of polymorphisms Other approaches: A selective sweep decreases the number of polymorphisms present in a population surrounding the gene that was driven into fixation due to positive selection. This provides an alternative to dN/dS ratios to detect genes under positive selection. Number of non-synonymous substitutions large dN If a site or a gene repeatedly was driven into fixation due to positive selection, its substitution rate will be higher than the mutation rate. This diversifying selection is frequently observed for sites interacting with immune system.
sites versus branches You can determine omega for the whole dataset; however, usually not all sites in a sequence are under selection all the time. PAML (and other programs) allow to either determine omega for each site over the whole tree, , or determine omega for each branch for the whole sequence, . It would be great to do both, i.e., conclude codon 176 in the vacuolar ATPases was under positive selection during the evolution of modern humans – alas, a single site does not provide any statistics ….
Sites model(s) work great have been shown to work great in few instances. The most celebrated case is the influenza virus HA gene. A talk by Walter Fitch (slides and sound) on the evolution ofthis molecule is here . This article by Yang et al, 2000 gives more background on ml aproaches to measure omega. The dataset used by Yang et al is here: flu_data.paup .
sites model in MrBayes The MrBayes block in a nexus file might look something like this: begin mrbayes; set autoclose=yes; lset nst=2 rates=gamma nucmodel=codon omegavar=Ny98; mcmcp samplefreq=500 printfreq=500; mcmc ngen=500000; sump burnin=50; sumt burnin=50; end;
hy-phy Results of an anaylsis using the SLAC approach
Hy-Phy -Hypothesis Testing using Phylogenies. Using Batchfiles or GUI Information at http://www.hyphy.org/ Selected analyses also can be performed online at http://www.datamonkey.org/
Example testing for dN/dS in two partitions of the data --John’s dataset Set up two partitions, define model for each, optimize likelihood
Example testing for dN/dS in two partitions of the data --John’s dataset Safe Likelihood Function thenselect as alternative The dN/dS ratios for the two partitions are different.
Example testing for dN/dS in two partitions of the data --John’s dataset Set up null hypothesis, i.e.: The two dN/dS are equal (to do, select both rows and then click the define as equal button on top)
Example testing for dN/dS in two partitions of the data --John’s dataset
Name and save as Null-hyp. Example testing for dN/dS in two partitions of the data --John’s dataset
Example testing for dN/dS in two partitions of the data --John’s dataset After selecting LRT (= Likelihood Ratio test), the console displays the result, i.e., the beginning and end of the sequence alignment have significantly different dN/dS ratios.
Example testing for dN/dS in two partitions of the data --John’s dataset Alternatively, especially if the the two models are not nested, one can set up two different windows with the same dataset: Model 1 Model 2
Example testing for dN/dS in two partitions of the data --John’s dataset Simulation under model 2, evaluation under model 1, calculate LR Compare real LR to distribution from simulated LR values. The result might look something like this or this