Download
1 / 15
150 likes | 241 Views
Learn how to customize SPSS for efficient data analysis. Use options to display variable names alphabetically, change labels, and improve variable identification. Enhance your analysis workflow with helpful SPSS tips.

E N D
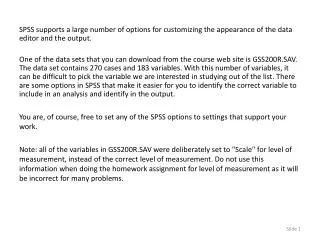
SPSS supports a large number of options for customizing the appearance of the data editor and the output. One of the data sets that you can download from the course web site is GSS200R.SAV. The data set contains 270 cases and 183 variables. With this number of variables, it can be difficult to pick the variable we are interested in studying out of the list. There are some options in SPSS that make it easier for you to identify the correct variable to include in an analysis and identify in the output. You are, of course, free to set any of the SPSS options to settings that support your work. Note: all of the variables in GSS200R.SAV were deliberately set to "Scale" for level of measurement, instead of the correct level of measurement. Do not use this information when doing the homework assignment for level of measurement as it will be incorrect for many problems.
The default listing for variables in statistical procedures is to show the variable labels in the same order that they appear in the data file. For example, LABOR FRCE STATUS is the variable label for the variable named wrkstat, NUMBER OF HOURS WORKED LAST WEEK is the variable label for hrs1, etc. When you are not familiar with a data set, this is a very difficult way to locate variables.
To change the display options in SPSS for either input dialog boxes or the display of output, select Options… from the Edit menu.
Displaying the variable names in alphabetical order is generally more efficient. First, click on the option button Display names to show names only in dialog boxes. Second, click on the option button Alphabetical to show names in alphabetical order. Third, click on the Apply button to make the change.
When you click on the apply button, SPSS displays this message to you about its response. Click on the OK button to confirm your intentions.
Now when we open the dialog for a statistical procedure, the variable list contains only the variable names, sorted in alphabetical order. Hint: typing a letter on the keyboard will jump the list to the position of that letter in the list box.
The default for variable names and labels in SPSS tables is to print the labels only. We can change this to print both. The default for displaying the different values for a variable in output tables is to print only the value labels. We can change this so it prints the numeric codes as well as the labels.
In the drop down menu for Variable labeling in Pivot Tables, select Names and Labels.
Select Values and Labels from the drop down menu for variable values in pivot tables. Click on the Apply button to make the changes effective.
The variable name appears in the title of the table along with the variable label. The numeric codes appear in the row headers of the table along with the label assigned to the different values.