Download
1 / 1
10 likes | 113 Views
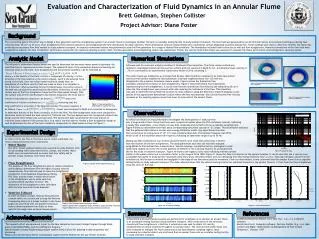
This project aimed to design and evaluate a flow generation and straightening system in an annular flume for sediment transport studies. Utilizing numerical simulations and analytic models, the system was constructed and optimized to meet flow requirements. Various measurements and analyses were conducted to assess the system's performance. The project involved comparing different flow straightener designs and determining the optimal motor power needed. Results indicated successful flow straightening and velocity control for research purposes.

E N D
Project Advisor: Diane Foster Background The overarching goal of this effort was to design a flow generation and flow straightening system in an annular flume to investigate whether this tank is a suitable testing facility to study sediment transport. The flow field was generated by two 40 lb thrust motors at incremental settings producing flow velocities from 15 cm/s to 35 cm/s. Flow straighteners then reduced turbulence and straightened the flow downstream for data collection. Three-dimensionalvelocity measurements werecollected at various designated locations downstream. These readings were used to determine whether the flume was producing the necessary flow field needed to study sediment transport. An analytic momentum balance was performed to size the flow generators for a range of desired flow conditions. The formulation included both friction due to wall and flow straighteners. Numerical simulations of the flow field were conducted to evaluate the flow straightener performance and predict the optimum sampling location. Next, the flow generation and straightening system was constructed. Finally, the velocity field within flume was measured to evaluate the flume performance and hydrodynamic sampling regime. Analytic Model Numerical Simulations Software used for numerical analysis consisted of Solidworks Flow simulation. The finite volume method was utilized to investigate theoretical flow and the uniform grid cell volume is 2.49(10-5) m3. A theoretical input velocity of .75 m/s correlated to an experimental inside motor thrust of 24 lb. at setting 3. The entire flume was modeled as an internal fluid domain. Wall conditions consisted of an inner pipe surface and inner wall surface modeled as fluid subdomain. A surface roughness factor (ks= .02 mm) was designated in the k-epsilon turbulence closure model. Figure 6 shows the theoretical flow simulation without the presence of flow straighteners. Figure 7 shows theoretical flow trajectories implementing the flow straighteners. It can be seen that the downstream flow velocity was reduced by 20 cm/s when the flow straighteners were present while also reducing the turbulence of the flow. This simulation was used to determine the optimal test location for datacollection using the VectrinoII. Figure 8 displays a cross section of the approximate downstream location where the flow was observed. One can see that the flow velocity increases as the sampling regime moves from inner to outer wall of the annular flume. • The volumetric momentum balance below was used to determine the necessary motor power to generate the specified flow for measurements down stream. The volumetric form of the momentum balance accounting for frictional losses on the walls, flow straighteners and thrust by the propeller, can be rewritten as • where is the density of the fluid, u is the x- component of velocity, n is the • direction of the flow relative to the control volume, and F is the external force • acting of the fluid. Once the initial model reached a steady flow, an • assumption of a uniform velocity field was made so there is no variation in • the θ direction. When accounting for the frictional losses, the surface area of • the tank was calculated by measuring the dimensions of the tank, as well as, the • surface area of the flow straightener tubes that the fluid passed through. With • the surface area of the contributing friction factors measured, the force due to • friction is equivalent to drag force. As shown where the • coefficient of friction is defined as indicating that the • drag coefficient is a function of the Reynolds number. The power equation is • as follows . Power was calculated in Watts and converted to Horsepower to determine the size of the motor necessary to drive the flow. Two flow straightener styles were compared to determine which provided the least amount of frictional loss. The two designs were the honeycomb stacked tube design and the other design was a porous block. The honeycomb style accounted for the least amount of frictional losses relative to the porous block. As a result, we were able to finalize a flow straightener design as well as determinethe size of the motor needed to compensate for those losses as shown in Figure 1. Figure 6:Theoretical flow trajectories without flow straighteners Figure 7: Theoretical flow trajectories with flow straighteners Figure 1: Power generation vs. tube length for a given flow field. Figure 8: Vertical cut plot at desired test section. Evaluation and Characterization of Fluid Dynamics in an Annular FlumeBrett Goldman, Stephen Collister Observations • An initial ten minute run was preformed to investigate the development of eddy currents • over a long period of time. Given that there were no spectrum spikes above the 95% confidence interval, indicating • a steady flow assumption, a two minute run was then conducted and verified to be an acceptable sampling time. • Figure 9 shows an observable noise floor and a corresponding turbulence cascade of -5/3 slope. This observation indicates • that the gathered data follows a normal wave energy dissipation model. Any signal below the noise • floor occurring at an energy level of 10-5 m2/s was considered bad data. The Nyquist frequency was 25 Hz, • which is half of the maximum observed frequency indicating an observable range of up to 50 Hz. • Testing was then conducted at four sections along the flume curve. Each test section was 3.33 feet • from the location of the flow straighteners.The data gathered at each test site was then analyzed • using Matlab to find optimal flow characteristics. Velocity readings, correlation factors, and signal to noise • ratios were studied to resolve the overall question of whether or not a circular flume is an acceptable test • site for the study of sediment transport. Figure 10 shows a low signal to noise ratio indicating minimal particle • scatter in the water column and a correlation factor in the range of 90 to 100%. Figure 11 shows the data set collected at the optimal location. It can be seen that the x velocity is an • acceptable flow speed to study particle movement while the y and z velocities remain at 0 cm/s deviating from this measurement by only 1.2 cm/s. This small deviation shows that the • turbulence at this location is minimal and negligible in the study of one directional particle movement. From our observations, it was confirmed that this annular flume is an acceptable • testing facility to study sediment transport. The data collected shows that the optimal testing location for sediment transport in the annular flume is 12 feet from the flow straighteners • along the curve of the tank. Experimental Design • In order to drive the flow in the flume and to collect valid data, the • three components below were constructed. • Motor Mount • Two 40 lb. thrust outboard motors were secured at a safe distance from • all surrounding walls using wood screws, clamps, and U-bolts. Motor • shafts were securely fastened to ensure tank liner safety and to • preventtorque resulting from motor thrust. • Flow Straighteners • The purpose of the flow straighteners were to reduce turbulence • and straighten downstream flow for higher accuracy velocity • measurements. The material used to make the straighteners • consisted of Crack-Resistant Polyethylene Tubing, • PVC Glue, and duct tape. A major specification • of the straighteners was to make sure they • could be placed anywhere in flume. The • dimensions of the straighteners were coincident • with the inner and outer flume diameter. • VectrinoII Mount • In order to obtain accurate velocity measurements • a mount had to be constructed to keep the Vectrino • II measuring device at a steady location in the flume. • Angle iron was fitted with two parallel horizontal • slots to allow translation from outer to inner • walls for thorough cross sectional measurements. Figure 9: Spectrum data. Figure 2: Annular flume experimental set up. Figure 3:(Left) Outboard motors and motor mount. Figure 11: Flow characteristics. Figure 10: 3D velocity readings. Figure 4:(Center) Flow straightener design showing arc angle consistent with flume Figure 5:(Right) Vectrino II mounted for data collection downstream. Summary References SolidWorks Education Edition. Vers. X64. N.p.: n.p., n.d. Computer software. Nortek Vectrino II. Computer software. Vectrino Profiler. N.p., n.d. Web. Loehrke and Nagib. "Experiments on Management of Free-Stream Turbulence." Chicago. 1972 A theoretical and experimental analysis was performed to investigate as to whether an annular flume is an acceptable testing facility to study sediment transport. After construction of the necessary mounts and flow straighteners, a Vectrino II velocimeter was used to obtain 3-D velocity measurements at various locations throughout an annular flume. The velocity field within flume was then measured to evaluate the flume performance and hydrodynamic sampling regime. Upon processing the collected data it was confirmed that an annular flume acts as a suitable testing facility to study sediment transport. Acknowledgements "This research effort was sponsored in part by the New Hampshire Sea Grant College Program through NOAA grant # NA10OAR4170082, and the UNH Marine Program.” Special thanks to Ocean Engineering graduate student Emily Carlson for assisting in data acquisition and processing. Thank you to Doctor Nancy Kinner and graduate student Charlie Watkins for the use of their facilities.